2.1.6.1.1 Mine footprints
To quantify the hydrological changes of mine developments, the location and spatial extent of the mine footprint over time is needed. Footprint polygons are used in the modelling to identify which cells in the models need to be modified to reflect impacts of mine development in the baseline and coal resource development pathway (CRDP).
Several sources of data were used to delineate footprint areas for groundwater and surface water modelling. Groundwater and surface water footprints are not the same. The maximum footprint for groundwater modelling is the union of the areas at the ground surface disturbed by open-cut mining and overlying underground extraction areas. The surface water footprint includes, in addition to the mine working area, other disturbed areas at the surface associated with site facilities, spoil dumps, roads and areas where runoff is intercepted and retained on site as part of a site’s mine water management plan.
To inform the modelling for the baseline coal resource development (baseline), historical footprint information was obtained from mine environmental impact statements (EIS) and similar reports, NSW Department of Trade and Investment (DTI), and by digitising the identifiable areas of open-cut mines from Landsat 5 TM imagery.
For additional coal resource development (ACRD) mines, the projected future mine footprints were obtained either directly from mining companies or from mine EIS and associated reports.
Table 17 summarises the sources of groundwater mine footprint data and mine flow rates for groundwater modelling. While the footprints have been obtained from a range of sources, flow rates were obtained only from EIS or similar reports. Table 18 summarises data sources for the surface water mine footprints used in the surface water modelling. Details of the source data and methods for extracting data are also provided. Mine extraction periods considered for each open-cut in the surface water modelling are also presented in Table 18. The mining periods were extracted from various mining company documents published at different times and there may be inconsistencies between reports. As noted in companion product 2.3 (conceptual modelling) for the Hunter subregion (Dawes et al., 2018), the dates used to determine whether a mine was baseline or additional coal resource development are not necessarily the same as the dates used for modelling. Differences are likely to be small (not more than a few years), and are unlikely to significantly impact the estimates of year of maximum difference between the modelled CRDP and baseline.
Table 17 Data sources for mine footprints and mine flow rates used in the groundwater modelling for the Hunter subregion
DTI = NSW Department of Trade and Investment, EIS = environmental impact statement, OC = open-cut, UG = underground
Table 18 Data sources for mine footprints used in the surface water modelling for the Hunter subregion
|
Mine |
Mining company |
Mining perioda |
Footprint source |
Reference or dataset |
|---|---|---|---|---|
|
Ashton |
Yancoal Australia |
2003–2035 |
Landsat 5 TM imagery, EIS and DTI |
Aquaterra (2009); RPS Aquaterra and Ashton Coal Operations Pty Ltd (2012); Wells Environmental Services (2009b); Bioregional Assessment Programme (Dataset 7); NSW Department of Industry, Resource and Energy Division (Dataset 9) |
|
Austar |
Yancoal Australia |
2005–2036 |
EIS and DTI |
Austar Coal Mine Pty Ltd (2013a); Umwelt Australia Pty Ltd (2008a); NSW Department of Industry, Resource and Energy Division (Dataset 9) |
|
Bengalla |
Rio Tinto |
1998–2049 |
Landsat 5 TM imagery, EIS and DTI |
WRM Water and Environment Pty Ltd (2013a); Bioregional Assessment Programme (Dataset 7); NSW Department of Industry, Resource and Energy Division (Dataset 9) |
|
Bulga |
Glencore |
1986–2035 |
Landsat 5 TM imagery, EIS, DTI and mining company |
Hansen Bailey Pty Ltd (2010) Umwelt Australia Pty Ltd (2013); Bioregional Assessment Programme (Dataset 7); NSW Department of Industry, Resource and Energy Division (Dataset 9); Glencore (Dataset 10, Dataset 11) |
|
Bylong |
KEPCO |
2017–2046 |
EIS |
Australasian Groundwater and Environmental Consultants Pty Ltd (2013b); WRM Water and Environment Pty Ltd (2015a) |
|
Dartbrook |
Anglo American |
1993–2016 |
EIS and mining company |
NSW Department of Planning (2005); Anglo-American (Dataset 12) |
|
Drayton |
Anglo American |
2007–2027 |
EIS |
|
|
Drayton South |
Anglo American |
2016–2036 |
EIS |
|
|
Glendell |
Glencore |
2007–2033 |
Google Earth imagery |
Bloomfield Group (Dataset 14) |
|
Hunter Valley Operations |
Rio Tinto |
1968–2040 |
Landsat 5 TM imagery and DTI |
Bioregional Assessment Programme (Dataset 7); NSW Department of Industry, Resource and Energy Division (Dataset 9) |
|
Integra |
Vale Australia |
1991–2045 |
Landsat 5 TM imagery, EIS and DTI |
Australasian Groundwater and Environmental Consultants Pty Ltd (2007); Environmental Resources Management Australia Pty Ltd (2009); SCT Operations Pty Ltd (2009); WRM Water and Environment Pty Ltd (2009); Bioregional Assessment Programme (Dataset 7); NSW Department of Industry, Resource and Energy Division (Dataset 9) |
|
Liddell |
Glencore |
1983–2044 |
Landsat 5 TM imagery, EIS and DTI |
Gilbert and Associates Pty Ltd (2013a); Bioregional Assessment Programme (Dataset 7); NSW Department of Industry, Resource and Energy Division (Dataset 9) |
|
Mangoola |
Glencore |
2008–2036 |
EIS and DTI |
WRM Water and Environment (2013b); NSW Department of Industry, Resource and Energy Division (Dataset 9) |
|
Moolarben |
Yancoal Australia |
2009–2055 |
EIS |
Patterson Britton and Partners Ltd (2006); Pegasus Technical (2009d); Worley Parsons Services Pty Ltd (2008) |
|
Mount Arthur |
BHP Billiton |
2001–2046 |
Landsat 5 TM imagery and EIS |
Gilbert and Associates Pty Ltd (2009); Gilbert and Associates Pty Ltd (2013b); Bioregional Assessment Programme (Dataset 7) |
|
Mount Owen |
Glencore |
1993–2047 |
EIS and DTI |
Umwelt Australia Pty Ltd (2014); NSW Department of Industry, Resource and Energy Division (Dataset 9) |
|
Mount Pleasant |
Rio Tinto |
2018–2056 |
EIS |
|
|
Mount Thorley-Warkworth |
Coal and Allied (Rio Tinto) |
1980–2057 |
Landsat 5 TM imagery and EIS |
Mackie Environmental Research (2002); WRM Water and Environment Pty Ltd (2014); Bioregional Assessment Programme (Dataset 7) |
|
Muswellbrook |
Muswellbrook Coal Company (Idemitsu) |
1983–2032 |
Landsat 5 TM imagery and DTI |
Bioregional Assessment Programme (Dataset 7); NSW Department of Industry, Resource and Energy Division (Dataset 9) |
|
Ravensworth Complex |
Glencore |
1999–2059 |
EIS and mining company |
Umwelt Australia Pty Ltd (2010a, 2010b); Glencore (Dataset 10) |
|
Rix's Creek |
Bloomfield Collieries |
1989–2058 |
Landsat 5 TM imagery, EIS and DTI |
AECOM Australia Pty Ltd (2015); Bioregional Assessment Programme (Dataset 7); NSW Department of Industry, Resource and Energy Division (Dataset 9) |
|
Ulan |
Glencore |
1980–2041 |
Landsat 5 TM imagery and EIS |
Umwelt Australia Pty Ltd (2009); Bioregional Assessment Programme (Dataset 7) |
|
Wambo |
Peabody Energy Australia |
1987–2036 |
Landsat 5 TM imagery, DTI and mining company |
Bioregional Assessment Programme (Dataset 7); NSW Department of Industry, Resource and Energy Division (Dataset 9); Wambo Coal Pty Ltd (Dataset 13) |
|
Wallarah 2 |
Wyong Coal |
2018–2056 |
EIS |
|
|
Wilpinjong |
Peabody Energy Australia |
2005–2102 |
EIS |
aMining period referred to in the table corresponds to assumed active phase of mine extraction for the open cut mines in the surface water model
DTI = NSW Department of Trade and Investment, EIS = environmental impact statement
Data: Bioregional Assessment Programme (Dataset 1, Dataset 2, Dataset 3, Dataset 4)
Environmental impact statements and other mine documents
Environmental impact statements (EIS), Director-General’s and Secretary’s environmental assessment reports, mining operation plans and water management plans were downloaded from the websites of the NSW Department of Planning and Environment Major Projects Assessments and mining companies.
The groundwater modelling uses the maximum extent of extraction, rather than a time series of extraction area, to define where pumping occurs. Reports were searched for maps or plans of the mine working areas that included spatial coordinates. The maximum mine working areas were digitised from these figures and georeferenced. The footprints have been simplified by reducing the number of vertices to speed up modelling while ensuring that mine footprints are never more than 300 m from known mining boundaries, such as the edge of mining extraction panels. The sources of data for each mine footprint for groundwater modelling are summarised in Table 17.
The depth of each footprint was determined and expressed as elevation in metres above the Australian Height Datum (mAHD). Most of the depths were contained in computer-aided design (CAD) drawings supplied by the mining companies. In some cases, the depths had to be found in the EISs and similar documents. The simplest of these were listed in the text, retrieved from a cross-section or stratigraphic column, or used pit or seam floor contour images. Other mine elevations were calculated by subtracting the depth of geological cover from the topographic elevation obtained from the EIS or Google Earth. For Integra Underground Coal Mine, the elevation of the Hebden seam was determined from seam floor contours. The approximate vertical separation between the Hebden seam, the Barrett seam and the Middle Liddell seam was calculated from the stratigraphic column of the mine (SCT Operations Pty Ltd, 2009, p. 2, Figure 2). From this information, the elevations of the Barrett and Middle Liddell seams were calculated. If none of these methods were possible, the depth of a nearby mine working was used instead. The groundwater footprints were exported in polygon file format (as .ply files) for groundwater modelling.
To obtain mine footprints for surface water modelling, the mining reports were searched for past and future projected mine layouts and surface water contributing areas. Each figure was digitised and georeferenced using one of four methods:
- The preferred method was to use maps or plans with coordinates already on them.
- If there were no coordinates, then three point locations were matched with points on Google Earth and the latitude and longitude from Google Earth were used to georeference the image.
- If there were not three clearly identifiable point locations in the image, then supplementary points were found by matching contour information to the Shuttle Radar Topography Mission Smoothed Digital Elevation Model (SRTM DEM-S) grid (Geoscience Australia, Dataset 5).
- Other site-specific approaches:
- Mangoola Coal Mine did not have adequate georeferencing points in the Year 10 and Final Landform images so these images were georeferenced to the matching project boundary in the other Mangoola Coal Mine images.
- The West Wallsend Colliery existing pit top surface facilities image, containing a satellite photo background, was georeferenced using Google Earth. The West Wallsend Colliery pit top facility outline was used to georeference the water management system image as they both contained the same outline.
The runoff contributing areas were calculated as a time series over the life of the mine, where possible. If a contributing area was not provided, the mine layout was used in conjunction with the SRTM DEM-S data to determine the area draining into the mine. Any area upslope of a water storage or dirty water area that was not diverted around the mine was included in the surface water mine footprint area. If these areas could not be determined from published information, only the area of the open-cut pit was used to define the mine footprint. The surface water footprints were exported as shapefiles (.shp) for modelling. Details of the mines and sources from which surface water mine footprints were obtained are summarised in Table 18.
Mining company spatial data
The Hunter Bioregional Assessment team (Assessment team) submitted a request to mining companies in the Hunter subregion for mine footprint data for the life of the mine, including the rehabilitation period. Some mining companies supplied mine footprint polygons under a restricted access licence agreement, which permits use for modelling purposes, but cannot be made publicly available. The mines for which footprints were obtained from mining companies are summarised in Table 17 and Table 18.
These mining companies provided approximately 600 files, mostly in AutoCAD and shapefile formats, but data were also provided as PDFs and PowerPoint documents. In most cases the data were provided in Map Grid of Australia (MGA) coordinates, otherwise these data were converted to MGA coordinates. Although some companies provided year-by-year mine plans from 2012 to mine completion, most data were provided at less frequent intervals, and some companies provided just the final mined area. Most data covered only future plans and did not include plans or discussion of historical operations. For open-cut operations, most data represented the pitshell, while for underground operations, the data represented individual longwall panels or perimeters of proposed mined areas. Some data were three-dimensional, with the elevation or depth of the mining seam or pit floor included. The data were synthesised manually, including combining various individual files where necessary, to produce the polygons (and seam-depth information, if available). During this process, the 500 m resolution of the groundwater model was always taken into account, which allowed a simplified polygonal representation that did not include individual roadways, bords, etc.
NSW Department of Trade and Investment historical data (2000 to 2012)
The Assessment team submitted a request to DTI for mine footprint data for Hunter subregion mines for every fourth year from 2000 to 2015. This interval was adopted as a convenient way of managing the size of the data request and providing a reasonable time step to represent the change in footprint areas over time. The dataset supplied was a complex assortment of files (10,937 files in 615 folders), including a number of format types (e.g. PDFs, shapefiles, e00 files, AutoCAD files) and containing information on different aspects of mine operations. In all, there were 473 e00 files and 1627 shapefiles that were potentially useful. Only a subset of these datasets represented the spatial extent of mine workings that were needed for defining the impacted areas for modelling. Some files for years other than those specifically requested were also included in the dataset supplied. All data were supplied under a restricted access licence agreement, which permits use for modelling purposes in the bioregional assessment, but cannot be made publicly available.
DTI also provided the drafting instructions sent to mines, which specify the formats in which mine footprint data are to be supplied to DTI by the mines. The drafting specifications have changed a few times over this period and adherence to the specifics of the standards has also varied, meaning that there was sufficient variability in file formats and naming conventions to make the extraction of the required data a very manual task of potentially limited value.
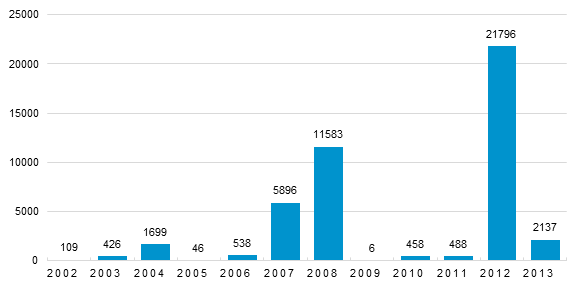
Following analyses of the files, a set of rules was developed based on the various file naming conventions to select the data files that were deemed most likely to contain mine working spatial data. A script was written that mined the folders for spatial files based on keywords, including mine name and year, in the file path name. For each of the files identified, an attempt was made to extract any polygon features. There were 45,267 mine footprint polygons extracted for 47 mines from 396 (19%) of the spatial data files. Figure 37 shows the number of polygons extracted for each year from the supplied data. The extracted data were biased towards the years 2008 and 2012, which reflects more consistent adoption by the mining sector of the formats and naming conventions specified in the drafting specifications. Comparatively few polygons were obtained for 2004 and none were obtained for 2000.
Data: NSW Department of Industry, Resource and Energy Division (Dataset 9)
Due to the large number of heterogeneous datasets, summarising the attribute data within these spatial datasets proved difficult. As a result, the attribute information should be viewed as indicative of the attributes in the underlying files.
Based on inspection of the data, the projection for most of the polygons was determined to be EPSG:28356 (MGA zone 56); however, a few of the source datasets were not in this projection and were not incorporated into the derived dataset (Bioregional Assessment Programme, Dataset 7 (restricted access)). DTI footprint areas were used for only some mines (see Table 17 and Table 18).
Landsat imagery open-cut mine footprints (1983 to 2002)
Landsat 5TM images were downloaded from Australian Geoscience Data Cube (AGDC; Geoscience Australia, 2015) between July and August 2015. The AGDC is an integrated gridded data analysis environment established by Geoscience Australia, CSIRO and the NCI, and maintained by Geoscience Australia. It contains the full archive of Australian Landsat 5 TM imagery. Images are provided at a one-by-one degree resolution (nominally 25 m) called a tile.
The historical open-cut mines for the Hunter subregion are covered by three tiles: 149_-033, 150_-033 and 151_-033. All available summer images, including both Landsat 5 TM and Landsat 7 ETM images, for the years 1987, 1992, 1997 and 2002 for these three tiles were downloaded (Geoscience Australia, Dataset 5). In addition, imagery was obtained for a number of open-cut mines that commenced between 2002 and 2008. This period was identified as a potential gap in the footprint data supplied by DTI because the early DTI files varied so much in format and naming conventions that consistent patterns for mining the files prior to 2007 could not be defined. Two open-cut mines had mine footprints digitised from Landsat images in 2004 and 2005.
Images were displayed in ArcMap for quality assessment and the best images were selected for digitising. Identifiable open-cut mine footprints were manually digitised in ArcGIS and saved as Arc shapefiles (Bioregional Assessment Programme, Dataset 7). Publicly available materials were used to help define the mine boundaries where necessary, including reports published by mine operators and Google Map. For example, a figure in an EIS from Rio Tinto (2015), which showed the boundaries between the Bulga, Mount Thorley-Warkworth and Wambo mining leases, was used to identify which open-cut mine in the imagery belonged to its respective mining operation.
The open-cut mine footprint areas obtained from the Landsat 5 TM imagery are summarised in Table 19.
Table 19 Mine footprint areas for open-cut mines in the Hunter subregion between 1987 and 2006
NA = data not available
Data: Geoscience Australia (Dataset 6), Bioregional Assessment Programme (Dataset 7)
Google Earth imagery
During the data compilation and pre-processing stage for generating the footprint time series, quality assurance checks were performed using Google Earth. During this process, some gaps were identified for the Glendell Coal Mine footprint areas and were resolved by digitising from the Google Earth imagery. These were obtained from images in years 2008, 2009, 2013 and 2015 (Bloomfield Group, Dataset 14).
2.1.6.1.2 Flow rates
The annual groundwater flow rate (also referred to as ‘mine water make’) is the amount of water that flows into the groundwater footprint area in a year. Mine reports were the source of flow rate information (see Table 17), in which flow rate data were typically published in tables or graphs of groundwater inflow or influx. The latest version of a report was used to accommodate for any overlap in data. When only a maximum flow rate was available, it was assumed that this flow rate would be achieved in the final year of mining, and that the flow rate would increase from zero at the commencement of mining to this maximum in a linear fashion. Where possible, the flow rates were split into individual pits or mine sections to more accurately reflect the distribution of groundwater inflow across the mine site. Any data gaps in groundwater flow rates were estimated by a linear interpolation between available data. Flow rates were assumed to be zero before mining commenced, and return to zero upon mine closure, unless otherwise indicated in the literature. Flow data were not obtained for the baseline Ulan open-cut mine and there were insufficient data to represent the additional coal resource developments of West Muswellbrook open-cut, Wambo underground and Wilpinjong open-cut in the groundwater model (see Section 2.3.4 of companion product 2.3 conceptual modelling for the Hunter subregion (Dawes et al., 2018)).
