All geographic data specific to the Hunter subregion were obtained from state or national datasets. This means no statistical analysis or interpolation was performed within the BA process to generate any of the geographic datasets. However, to characterise errors of the input climate data used for the water balance modelling, some subregion-specific spatial analysis was undertaken.
In addition to generating daily and monthly grids of meteorological variables (P, Tmax and Tmin), the Bureau of Meteorology (Jones et al., 2009) also generate daily and monthly RMSE grids of the same variables. These daily and monthly RMSE grids are a combined measure of the observational error and geostatistical error, the latter being a function of the interpolation algorithm, density of isolated station observations and degree of spatial autocorrelation of the process(es) driving the spatial variance captured in the data being interpolated.
To characterise errors of the input climate data, the long-term (from January 1980 to December 2009) monthly mean and RMSE values for rainfall (P), max temperature (Tmax) and minimum temperature (Tmin) were calculated. Relative errors, expressed as a percentage, were calculated by dividing monthly RMSE mean grid by the monthly mean grids for each meteorological variable.
The spatially-averaged long-term monthly mean rainfall for the Hunter subregion is 64 mm/month (Figure 3a) with a RMSE of 30 mm/month (Figure 3b). This results in a relative error of 48% in the input rainfall grids (Figure 3c). The relatively high error is due in part to the high spatial and temporal variability in rainfall and relatively low degree of spatial autocorrelation, which may not be sufficiently captured through the network of meteorological stations. Relative error tends to be lower in the coastal areas and around the larger inland towns, reflecting the denser network of rainfall gauges, and higher in the less populous areas, such as the conservation areas in the south-west, where the rainfall station network is sparse.
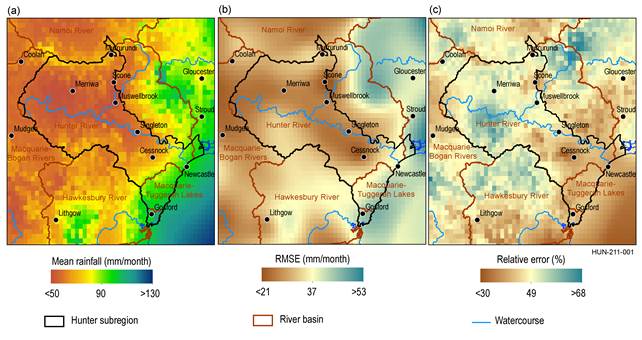
Figure 3 Spatial variation of precipitation from 1980 to 2009
(a) monthly mean precipitation, (b) monthly mean root mean square error (RMSE) precipitation and (c) monthly mean precipitation relative error for the Hunter subregion and proximal surface water basins
Data: Bureau of Meteorology (Dataset 6), Bioregional Assessment Programme (Dataset 7)
For air temperatures, a meteorological field that has higher spatial autocorrelation than rainfall, the regional distribution is governed by topography and distance from the ocean. The Tmax spatially-averaged long-term monthly mean is 22.9 °C (Figure 4a) with a RMSE of approximately 0.4 °C (Figure 4b) for the Hunter subregion. This results in a relative error of 1.8% for Tmax (Figure 4c). Tmin has a similar spatial pattern, with a spatially-averaged long-term monthly mean of 10.5 °C (Figure 5a), a RMSE of approximately 0.6 °C (Figure 5b) and a relative error of 6.1% (Figure 5c).
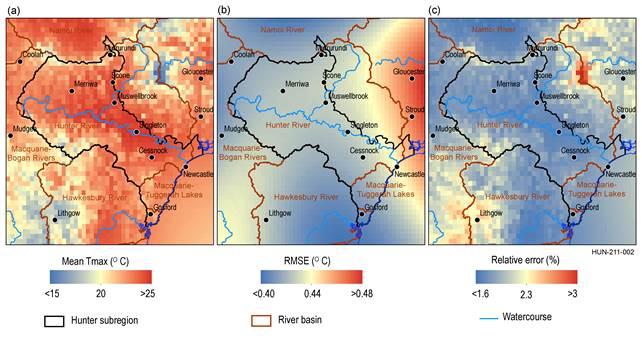
Figure 4 Spatial variation of maximum air temperature (Tmax) from 1980 to 2009
Data: Bureau of Meteorology (Dataset 6), Bioregional Assessment Programme (Dataset 7)
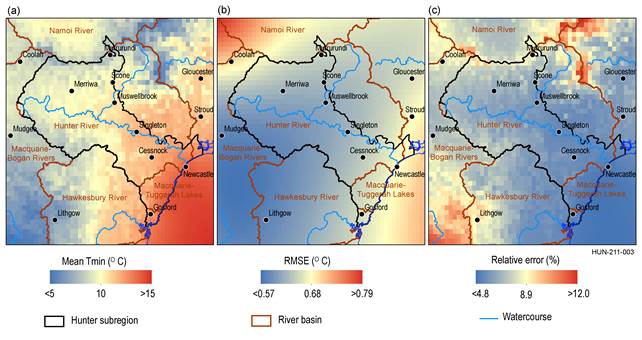
Figure 5 Spatial variation of minimum air temperature (Tmin) from 1980 to 2009
Data: Bureau of Meteorology (Dataset 6), Bioregional Assessment Program (Dataset 7)
