2.1.2.1 Observed data


Three types of observed data were used to develop and build a geological model for the Hunter subregion: deep wells datasets (DTIRIS NSW, Dataset 1; CSIRO, Dataset 2, Dataset 4; Bioregional Assessment Programme, Dataset 3), surface geological maps (Geoscience Australia, Dataset 5) and geophysical datasets (Geoscience Australia, Dataset 6, Dataset 7).

The deep wells dataset consists of stratigraphic and lithological data extracted from petroleum exploration well completion reports (WCRs) (WCR details are included within the list of references following Section 2.1.2.3). Other well data are available, such as groundwater bores and coal bores that could provide more detail within each shallow geological level, but they were not integrated into the model due to time and resource constraints and the objective of building a model fit for regional-scale groundwater modelling.

The geophysical and geological maps datasets comprise regional-scale data that could be incorporated into a model with a 2 km2 grid cell resolution within the available time and resources. The selected datasets comprise SRTM (Shuttle Radar Topography Mission) topography (Geoscience Australia, Dataset 7), bathymetry (Geoscience Australia, Dataset 6) and deep structure datasets, the 1:2,500,000 scale Geological Map of NSW (Scheibner, 1999) and the stratigraphy, structural and isopach maps described in companion product 1.1 for the Hunter subregion (McVicar et al., 2015). Maps based on these datasets are published in this companion product as follows:

2.1.2.1.1 Deep wells dataset

The deep wells data (DTIRIS NSW, Dataset 1; CSIRO, Dataset 2, Dataset 4; Bioregional Assessment Programme, Dataset 3) provide information about the rock types and stratigraphic unit limits of the Hunter subregion from geophysical logs, core and cutting analyses summarised in the WCRs (see the listing of WCRs within the list of references following Section 2.1.2.3).

The first wells were drilled in the 1920s by the Thrift Mineral Prospecting Syndicate. The rate of deep well drilling increased in the 1960s with the Australian Oil and Gas Corporation Ltd exploration campaigns. In the late 1980s and early 1990s, CSG emerged as a viable development opportunity and provided the motivation to drill more wells. Sydney Gas Ltd, Sydney Gas Operations, Macquarie Energy Pty Ltd and AGL Energy Limited have been responsible for most of the drilling in the last 15 years.

In all, 105 WCRs were consulted and included all onshore deep wells in the Hunter subregion, as well as those within 50 km of its boundaries (104 wells) and one offshore well, located within 50 km of the subregion (Table 3). The offshore well is New Seaclem 1 and was drilled in 2011 (Advent Energy, 2011). A full listing of the WCRs is provided within the list of references following Section 2.1.2.3.

Table 3 List of petroleum wells with well completion reports publicly available in the Hunter subregion


Well name

Date

Company

Latitude

Longitude

Total depth

(m MD KBa)

Allambi 1C

2007

Eastern Star Gas Limited

–31.9229°

149.6865°

385

Balmain 1

1937

Natural Gas and Oil Corporation Ltd

–33.8517°

151.1777°

1504

Baulkham Hills 1

1961

Australian Oil and Gas Corporation Ltd

–33.7502°

151.0084°

1067

Belford 1

1965

Australian Oil and Gas Corporation Ltd

–32.6529°

151.2847°

1175

Belford Dome 1

1930

Unknown

–32.6472°

151.2852°

472

Berkshire Park 1

1968

Australian Oil and Gas Corporation Ltd

–33.6798°

150.7905°

1091

Big Adder Hill 1

1995

Amoco Australia Development Company Ltd

–32.4771°

150.7760°

657

Black Springs 1

2008

Sydney Gas Ltd

–32.1636°

150.6523°

761

Bootleg 2A

1982

Australian Gas Light Company Ltd / OXY

–33.6871°

151.0604°

1411

Bootleg 3

1982

Australian Gas Light Company Ltd / OXY

–33.1433°

151.4179°

406

Bootleg 4

1982

Australian Gas Light Company Ltd / OXY

–33.3790°

151.4720°

748

Bootleg 5

1981

Australian Gas Light Company Ltd / OXY

–33.1299°

150.6927°

1099

Bootleg 6

1982

Australian Gas Light Company Ltd / OXY

–33.2022°

150.9740°

898

Bootleg 7

1982

Australian Gas Light Company Ltd / OXY

–33.4329°

150.8632°

1072

Brawboy 1

2009

Santos QNT Pty Ltd

–31.8974°

150.6419°

1435

Brawboy 2

2010

Santos QNT Pty Ltd

–31.9043°

150.6425°

1089

Bulga 1

1994

Amoco Australia Petroleum Company Ltd

–32.6939°

151.0158°

1097

Camberwell 1

1966

Australian Oil and Gas Corporation Ltd

–32.5405°

151.1018°

1903

Camberwell 2

1986

Sydney Oil Company Pty Ltd

–32.5412°

151.1055°

1173

Cape Three Points 1

1974

Robertson Research Australia Pty Ltd

–33.4779°

151.4405°

610

Catherine Hill Bay 1

2009

Macquarie Energy Pty Ltd

–33.1620°

151.6301°

1099

Coolahville 1C

2007

Eastern Star Gas Limited

–31.8444°

155.6986°

396

Cuan 1

2010

Santos QNT Pty Ltd

–31.9724°

150.6433°

1422

Dartbrook 1

2009

AGL Energy Limited

–32.1349°

150.8001°

895

Doolans Creek 1

1995

Amoco Australia Petroleum Company Ltd

–32.2154°

150.3090°

945

Dural 1

1957

Australian Oil and Gas Corporation Ltd

–33.6856°

151.0567°

1586

Dural 3

1958

Australian Oil and Gas Corporation Ltd

–33.6667°

151.0163°

1971

Dural South 1

1966

Shell Development Pty Ltd

–33.7084°

151.0161°

3059

East Dunlop 1

1995

Amoco Australia Petroleum Company Ltd

–32.1390°

150.2987°

1094

East Maitland 1

1963

Planet Exploration Company Pty Ltd

–32.7609°

151.6176°

3049

Elizabeth Macarthur 21V

2004

Sydney Gas Ltd

–34.1138°

150.7261°

640

Farley 1

1935

W. Maskell

–32.7510°

151.5106°

1635

Farley 2

1959

Sun Oil and Gas Company of California

–32.7316°

151.4922°

632

Fullerton 1

2011

Dart Energy Limited

–32.8086°

151.8379°

901

Fullerton 2

2011

Dart Energy Limited

–32.8406°

151.8369°

1152

Fullerton 3

2011

Dart Energy Limited

–32.8308°

151.8251°

853

Fullerton 4

2011

Dart Energy Limited

–32.8180°

151.8793°

750

Goulburn River 1

1995

Amoco Australia Development Company Ltd

–32.4236°

150.6534°

609

Hawkesbury Bunnerong 1

1993

Pacific Power

–33.9702°

151.2300°

1251

Hawkesbury Eveleigh 1

1995

Pacific Power

–33.8958°

151.1938°

1317

Hawkesbury Lisarow 1

1991

Pacific Power

–33.3757°

151.3846°

1000

Hawkesbury Munmorah 1

1992

Pacific Power

–33.2328°

151.4994°

260

Hawkesbury Munmorah 2

1993

Pacific Power

–33.2341°

151.5001°

269

Hawkesbury Munmorah 3

1994

Pacific Power

–33.2351°

151.4952°

245

Higher Macdonald 1

1968

Australian Oil and Gas Corporation Ltd

–33.2137°

150.9339°

628

Howes Swamp 1

1970

Esso Exploration and Production Australia Inc

–33.1289°

150.6919°

2570

Hunter Bulga 1

2004

Sydney Gas Ltd

–32.7412°

151.1051°

537

Hunter Bulga 2

2004

Sydney Gas Ltd

–32.7433°

151.1108°

531

Hunter Corehole 3

2007

Sydney Gas Ltd

–32.6473°

150.9852°

906

Hunter Corehole 1

2009

Sydney Gas Ltd

–32.6580°

151.1319°

900

Hunter Coricudgy 1

1992

Pacific Power

–32.8557°

150.3477°

865

Hawkesbury Llanillo 1

1991

Pacific Power

–32.4360°

150.8365°

766

Hawkesbury Randwick Park 1

1991

Pacific Power

–32.439°

150.8026°

700

Jerrys Plains 1

1969

Esso Exploration and Production Australia Inc

–32.4730°

150.9412°

1595

Jilliby 1

2004

Sydney Gas Operations (Wyong)

–33.2543°

151.3865°

621

Jilliby 13

2005

Sydney Gas Operations (Wyong)

–33.2420°

151.3881°

613

Jilliby 1B

2004

Sydney Gas Operations (Wyong)

–33.2560°

151.3867°

500

Jilliby 2

2004

Sydney Gas Operations (Wyong)

–33.2366°

151.3723°

591

Kenthurst 1

1963

Australian Oil and Gas Corporation Ltd

–33.6615°

151.0183°

1067

Knight 1

2002

Sydney Gas Company NL

–32.7009°

151.0540°

748

Kulnura 1

1964

Australian Oil and Gas Corporation Ltd

–33.2138°

151.1972°

2473

Kurrajong Heights 1

1962

Australian Oil and Gas Corporation Ltd

–33.5268°

150.6196°

2783

Loder 1

1927

Oil And Gas Investigations Ltd

–32.6268°

151.1260°

729

Loder 1

1963

Australian Oil and Gas Corporation Ltd

–32.6322°

151.1334°

2063

Longley 1

1973

North West Oil and Minerals Company NL

–33.3561°

151.2886°

1031

Lower Portland 1

1968

Australian Oil and Gas Corporation Ltd

–33.4326°

150.8635°

886

Macdonald 2

1971

Metals Investment Holdings NL

–33.3182°

150.9632°

752

Maison Dieu 1

2008

Sydney Gas Ltd

–32.5148°

151.0698°

292

Martindale 1/1A

1967

Australian Oil and Gas Corporation Ltd

–32.5160°

150.6153°

1181

Meads Crossing 1

2011

Planet Gas Limited

–32.2656°

150.0916°

590

Mellong 1

1964

Australian Oil and Gas Corporation Ltd

–32.9995°

150.7122°

905

Millfield 1

1966

Australian Oil and Gas Corporation Ltd

–32.8759°

151.2077°

644

Monkey Place 1

2010

AGL Energy Limited

–32.7459°

151.1468°

556

Monkey Place 2

2010

AGL Energy Limited

–32.7425°

151.1450°

571

Monkey Place 3

2010

AGL Energy Limited

–32.7467°

151.1422°

571

Monkey Place 4

2010

AGL Energy Limited

–32.7478°

151.1477°

685

Mt Murwin 1

1963

Australian Oil and Gas Corporation Ltd

–32.8492°

150.9504°

887

New Seaclem

2011

Advent Energy Limited

–32.9304°

153.3736°

750

North Castlereagh 1

1993

Amoco Australia Petroleum Company Ltd

–33.6387°

150.6780°

1320

North Colah 1

1971

Metals Investment Holdings NL

–33.6098°

151.1089°

837

Oakdale 1

2009

Santos QNT Pty Ltd

–31.7587°

155.8618°

892

Paynes Crossing 1

2008

Sydney Gas Ltd

–32.8757°

151.0826°

1082

Pinegrove 1

2002

Sydney Gas Ltd

–32.5624°

150.9650°

511

Riverstone 1

1992

Amoco Australia Petroleum Company Ltd

–33.6769°

150.8130°

1537

Rothanal 1

2008

Sydney Gas Ltd

–32.6783°

151.2651°

866

Rouchel Rouchel 1

2009

Santos QNT Pty Ltd

–31.9881°

150.8061°

484

Rouchel Rouchel 2

2009

Santos QNT Pty Ltd

–31.9881°

150.8061°

999

Roughit 1

2008

Sydney Gas Ltd

–32.5724°

151.2575°

1064

Sedgefield 1

1964

Australian Oil and Gas Corporation Ltd

–32.5113°

151.2546°

687

Shearman 1

1989

Command Petroleum NL

–32.8436°

151.8105°

739

Singleton 1

1992

Amoco Australia Petroleum Company Ltd

–32.5334°

151.1411°

1299

St Albans 1

1970

Metals Investment Holdings NL

–33.3559°

150.9787°

845

Terrigal 1

1961

J. Stevens

–33.4393°

151.4312°

1886

Turill 1

2010

Santos QNT Pty Ltd

–32.0627°

150.0555°

1110

Turnermans 1

2009

AGL Energy Limited

–32.4787°

150.6772°

727

Wappinguy 1

2009

Sydney Gas Ltd

–32.2089°

150.4841°

901

Whybrow 2

1986

Sydney Oil Company Pty Ltd

–32.6774°

150.9822°

610

Windermere 1

2010

AGL Energy Limited

–32.6400°

151.0220°

623

Windermere 2

2010

AGL Energy Limited

–32.6431°

151.0208°

615

Windermere 3

2010

AGL Energy Limited

–32.6400°

151.0158°

609

Windermere 4

2010

AGL Energy Limited

–32.6433°

151.0252°

733

Windy Hill 1

1992

Amoco Australia Petroleum Company Ltd

–32.8543°

151.6417°

928

Wollombi Brook 1

1994

Amoco Australia Petroleum Company Ltd

–32.7633°

151.0769°

996

Woodbury 1

1966

Planet Exploration Company Pty Ltd

–32.7892°

151.6822°

671

Wybong 1

1995

Amoco Australia Petroleum Company Ltd

–32.2734°

150.6548°

763

adepths are measured depth (MD) relative to the kelly bushing (KB). A kelly bushing is an adapter that connects the rotary table to the kelly which transmits the rotary motion to the drillstring during drilling.

Data: see the listing of well completion reports within the list of references following Section 2.1.2.3

Well distribution varies across the Hunter subregion (Figure 6). The highest concentrations are in the Hunter Coalfield around Singleton, and the Newcastle Coalfield between Lake Macquarie and Tuggerah Lakes. However, much of the subregion has sparse deep wells data. The measured depths (MD) of these wells vary between 245 m MD (well Hawkesbury Munmorah 3) and 3059 m MD (well Dural South 1) relative to the kelly bushing (KB) at the top of each well, just above ground level (a kelly bushing is an adapter that connects the rotary table to the kelly – a square or hexagonal steel bar with a hole drilled through the middle for a fluid path – which transmits the rotary motion to the drillstring during drilling). The quality of the stratigraphic and structural interpretations is variable, reflecting the ages of the wells and differences in geological interpretation from one company to another and from one coalfield to another. The data that can be used to construct a regional geological model are identified as part of the statistical analysis (Section 2.1.2.2.3).

Figure 6

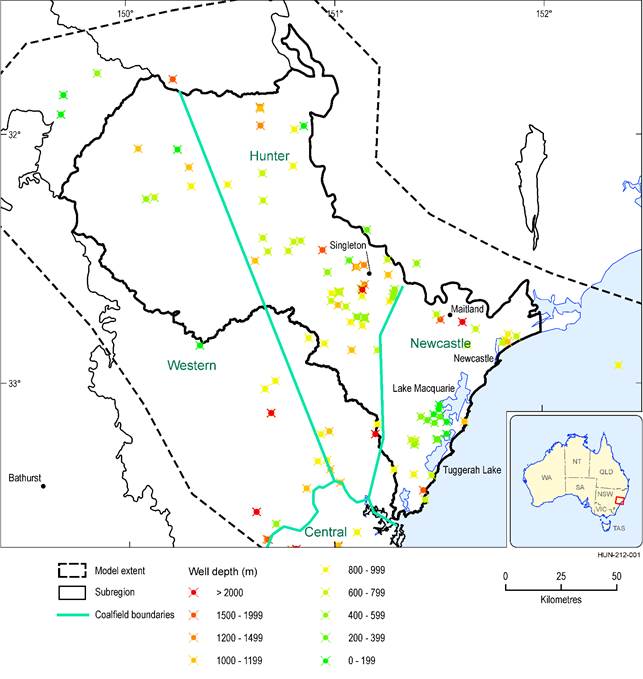
Figure 6 Spatial distribution of petroleum wells within the Hunter subregion

GL = ground level; well depths are relative to ground level in this figure

Data: CSIRO (Dataset 2)

2.1.2.1.2 Geological maps and geophysical datasets

Onshore topography and offshore bathymetric datasets were used to map the upper surface of the Hunter subregion. The surface topography used in the geological model was extracted from a 3‑second digital elevation model (DEM) (Geoscience Australia, Dataset 7). The offshore bathymetric surface was extracted from 9-second bathymetry data (Geoscience Australia, Dataset 6). Both datasets are described in Section 2.1.1. The grids were reprojected to Australian Map Grid (AMG) zone 56 with a cell resolution of 90 m to fit with the petroleum well coordinate system and get the best from the data with reasonable computer processing performance. This resolution is compatible with the 2 km2 cell size of the model. The base of the Hunter subregion geological model was extracted from the Structurally Enhanced view of Economic Basement data (known as OZ SEEBASE) (FrOG Tech, Dataset 8). This dataset provides depth to basement model all over Australia and was used because it is publicly available.

Existing data about geological structures (folds and faults), as well as stratigraphic unit extents and thicknesses, are in Section 1.1.3 of companion product 1.1 for the Hunter subregion (McVicar et al., 2015). These data, which are also listed in Section 2.1.2.1, were digitised and integrated in the three-dimensional model calibration dataset (see Section 2.1.2.2.3).

Last updated:
18 January 2019
Thumbnail of the Hunter subregion

Product Finalisation date

2018

ASSESSMENT