2.1.4.1.1 Stage and streamflow data
There are 43 streamflow gauging stations (Bioregional Assessment Programme, Dataset 1) in the subregion: 39 are located in the Hunter river basin and have gauge IDs with the prefix 210---, and four are located in the Macquarie-Tuggerah lakes basin and have gauge IDs prefixed by 211--- (Figure 32). There are 34 and 14 gauging stations used for AWRA-R and AWRA-L surface water model calibrations, respectively. The site details and data used for surface water modelling are summarised in Table 8.
Table 8 Gauge information for streamflow data for the Hunter subregion
AWRA-R = Australian Water Resources Assessment river model
AWRA-L = Australian Water Resources Assessment landscape model
Data: Bioregional Assessment Programme (Dataset 1)
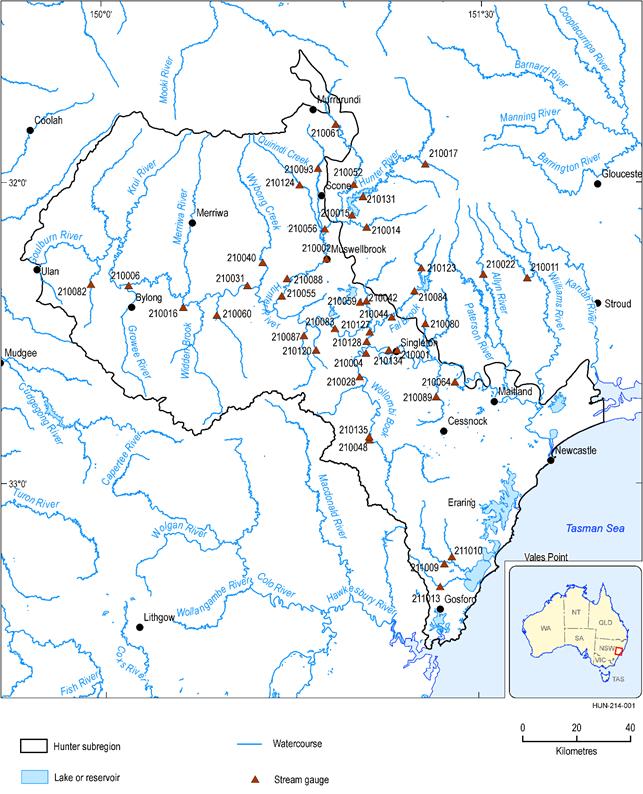
Figure 32 Location of stream gauges in the Hunter subregion (listed in Table 8)
Data: Bioregional Assessment Programme (Dataset 1, Dataset 15), Bureau of Meteorology (Dataset 14)
The daily streamflow values in the time series are aggregated from instantaneous observations of streamflow that have been converted from observed stage height using a rating curve. Thus the quality of the streamflow records depend on the quality of the rating curves.
Using the numerical quality codes that are part of the streamflow data records, the daily streamflow data were processed into unified six-class quality codes for each gauge (Viney et al., 2011; Zhang et al., 2013) (Table 9). The six unified quality categories are defined as follows:
- good: data are an accurate representation of streamflow
- fair: data are a moderately accurate representation of streamflow
- poor: data are a poor representation of streamflow and may be unsuitable for some quantitative applications
- unverified: data quality is not known
- non-conforming: data are unsuitable for most applications requiring quantitative analysis, but may contain useful qualitative information
- missing: data are missing or unusable.
Streamflow data flagged as good, fair, poor or unverified were kept while the flow data flagged as non-conforming were excluded. The non-conforming and missing streamflow data are both labelled in the dataset as –9999.
Table 9 Quality codes for the NSW gauges for the Hunter subregion
|
Numerical codes |
Description |
|---|---|
|
<17, 30, 32–34, 36–39, 94 |
Good |
|
17, 31, 40–46, 57–58, 82, 95 |
Fair |
|
26, 51, 54, 60–75, 80, 91, 100,140 |
Poor |
|
130 |
Unverified |
|
35, 52, 77, 152 |
Non-conforming |
|
153–255 |
Missing |
Data: Bioregional Assessment Programme (Dataset 1)
Figure 33 summarises the percentage of each quality code for each streamflow gauge. No streamflow gauges have non-conforming data. Most of the data falls into the categories of ‘good’, ‘fair’ and ‘unverified’. The amount of missing data for eight catchments accounts for more than 30%.

Figure 33 Percentage of streamflow data in each quality code class by gauging station
Data: Bioregional Assessment Programme (Dataset 1)
The stage and streamflow data are used as provided in the calibration of surface water models reported in companion product 2.6.1 for the Hunter subregion (Zhang et al., 2018).
2.1.4.1.2 River cross-sections
Information on stream cross-sections are used in AWRA-R to represent the geometry of a river reach. A river reach is defined for modelling purposes as the runoff contributing area between two streamflow gauges or simulation nodes. This definition expands on the more traditional definition of a reach, which includes only the segment of river between two streamflow gauges or simulation nodes. Reach geometry – as defined by the upstream and downstream cross-sections – is used in AWRA-R to compute instream actual evapotranspiration and rainfall fluxes, instream capacity and losses to groundwater (Lerat et al., 2013; Dutta et al., 2014). The cross-sections for 34 streamflow gauges used in AWRA-R (Table 8) were obtained from CSIRO (Dataset 2). These, plus the 22 headwater derived cross-sections (see Section 2.1.4.2.1), defined the calibration node-link network (CSIRO Land and Water, Dataset 7), where a link is defined as the element that routes water through the system.
DPI Water collects cross-section data every few years. In AWRA-R, only the latest or most detailed (for example, the one with more distance measurements) was used, hence potential changes in cross-section due to scour and re-deposition of sediment after peak flows are not reflected in the model (McMillan et al., 2010). In addition, distances between gauges vary from a few to tens of kilometres, which may result in an underestimation or overestimation of the river width and depth when averaging the river instream capacity from the upstream and downstream cross-sections. Model calibration will partially compensate proportional biases arising from this underestimation.
