Table 22 summarises the areas of changed surface water hydrology for three key points in the footprint time series for each open-cut mine: end of 2012 prior to commencement of any additional coal resource development mines in the CRDP; the maximum disturbed area represented in the model; and the final disturbed area following full rehabilitation. Open-cut mines and site facilities (whether they be for open-cut or underground operations) are included in the areas given, as they have the same hydrological effect in the surface water model. The table also includes the maximum disturbed area at the surface for underground mines (final column). Maximum extent, maximum seam depth and maximum flow rate for each mine working represented in the Hunter subregion groundwater model are summarised in Table 23. The data in Table 22 and Table 23 were extracted from the various sources identified in Table 17 and Table 18.
Table 22 Key characteristics of data used to represent mine impacts in the surface water model for the Hunter subregion
baseline = baseline coal resource development, OC = open-cut, UG = underground, na = not applicable
Mines in the coal resource development pathway (CRDP) include mines in the baseline and additional coal resource developments. Data from various sources (see Table 18)
Data: Bioregional Assessment Programme (Dataset 1, Dataset 2, Dataset 3, Dataset 4, Dataset 21)
Table 23 Key characteristics of data used to represent mine impacts in the groundwater model for the Hunter subregion
areported maximum is 558 ML/y, but lower value was used in modelling due to mine being put in care and maintenance
baseline = baseline coal resource development, ACRD= additional coal resource development, OC = open-cut, UG = underground, na = not applicable
Mines in the coal resource development pathway (CRDP) include the mines in the baseline and additional coal resource developments. Data from various sources (see Table 17)
Data: Bioregional Assessment Programme (Dataset 22, Dataset 23, Dataset 24, Dataset 25)
Figure 38 and Figure 39 illustrate spatial distribution of the maximum footprint areas under baseline (Figure 38) and additional coal resource development (Figure 39) for surface water and groundwater models in the Hunter subregion. As discussed in Section 2.3.4 of companion product 2.3 for the Hunter subregion (Dawes et al., 2018), not all mines are incorporated in both the surface water and groundwater models for both baseline and CRDP model runs. There were mines where flow rate data were not available and other mines where the surface water models were not able to represent the key processes influencing local hydrology (e.g. tidal dynamics and urban runoff), which precluded them from being modelled.
Figure 40 shows the footprint time series for baseline and CRDP for the period from 1983 to 2102. These time series were derived for each mine from available data (points) using the assumptions summarised in Table 20. The time series baseline and CRDP data are used in surface water modelling to estimate impacts of the additional coal resource development mines on hydrological response variables. The hydrological impacts are reported in companion product 2.6.1 for the Hunter subregion (Zhang et al., 2018).
Figure 41 shows the flow rate time series for baseline and CRDP mine areas for the period from 1968 to 2058. Deriving the time series from available data (points) for each mine is based on the assumptions described in companion product 2.6.2 for the Hunter subregion (Herron et al., 2018). Some plots present a flow rate time series for multiple mines (e.g. Bloomfield plot includes Donaldson; Newstan and Awaba) or by complex (e.g. Mt Owen Complex includes Glendell, Mount Owen and Ravensworth East open-cuts). When time series for individual workings are combined into a single time series, the maximum flow rate is not necessarily equal to the sum of the individual maxima (Table 23), which may occur in different years. The time series baseline and CRDP data are used in groundwater modelling to estimate the effects of the additional coal resource developments on hydrological response variables and are reported in Herron et al. (2018). There can be differences in the start and end dates used in the surface water and groundwater models, which reflect lack of certainty about when additional coal resource development mines will commence, assumptions about when groundwater pumping commenced and ceased and assumptions about how long impacts of mining are sustained after mining ceases (see Table 20).
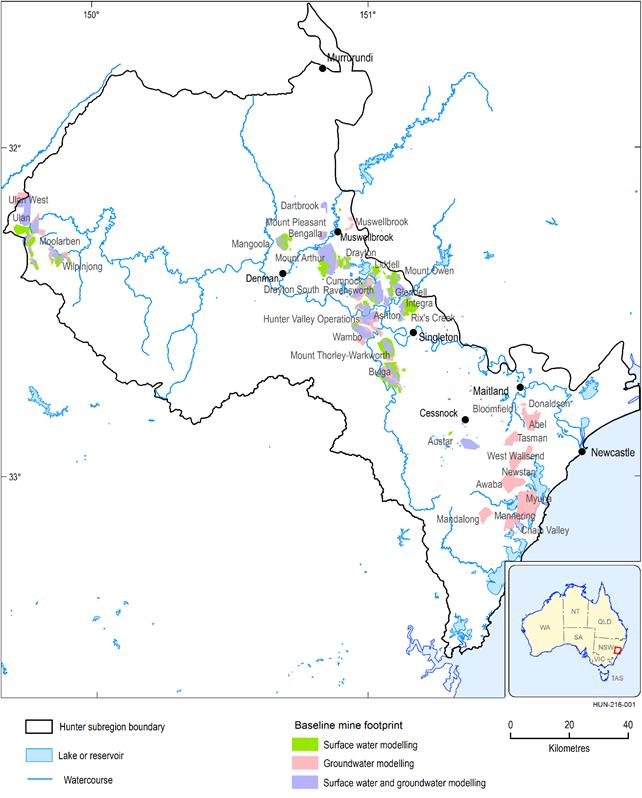
Figure 38 Maximum footprint areas for baseline mines used in surface water and groundwater models
Baseline coal resource development (baseline) is defined as a future that includes all coal mines and coal seam gas (CSG) fields that are commercially producing as of December 2012. This figure is not representative of all mines in the baseline. Maximum footprint areas for mines in the baseline depict only those mines with sufficient data and information to be qualitatively assessed through surface water and groundwater modelling.
Data: Bioregional Assessment Programme (Dataset 21, Dataset 22, Dataset 23, Dataset 24, Dataset 25)
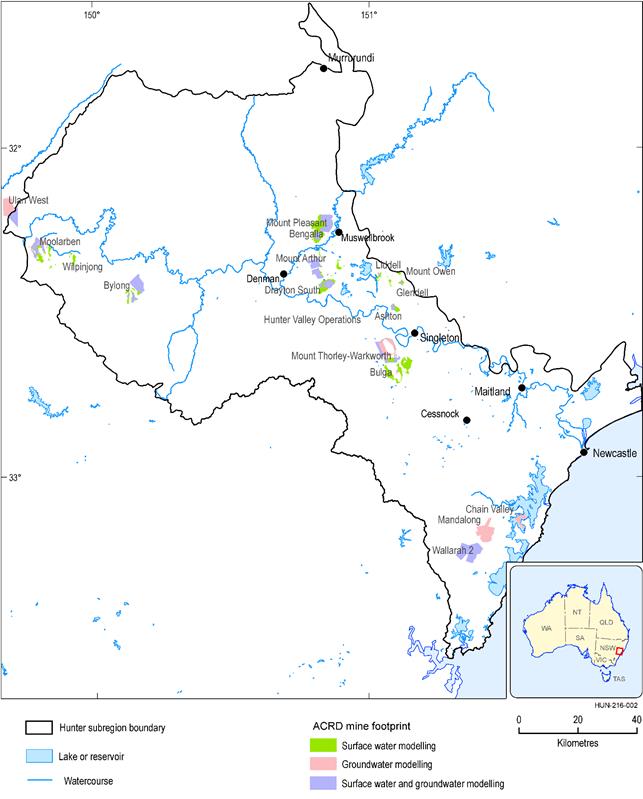
ACRD is defined as all coal mines and coal seam gas (CSG) fields, including expansions of baseline operations, that are expected to begin commercial production after December 2012. CRDP is defined as a future that includes all coal mines and coal seam gas (CSG) fields that are in the baseline as well as those that are expected to begin commercial production after December 2012.
This figure is not representative of all ACRD mines in the CRDP. Maximum footprint areas for ACRD depict only those ACRDs with sufficient data and information to be qualitatively assessed through surface water and groundwater modelling.
Data: Bioregional Assessment Programme (Dataset 21, Dataset 22, Dataset 23, Dataset 24, Dataset 25)
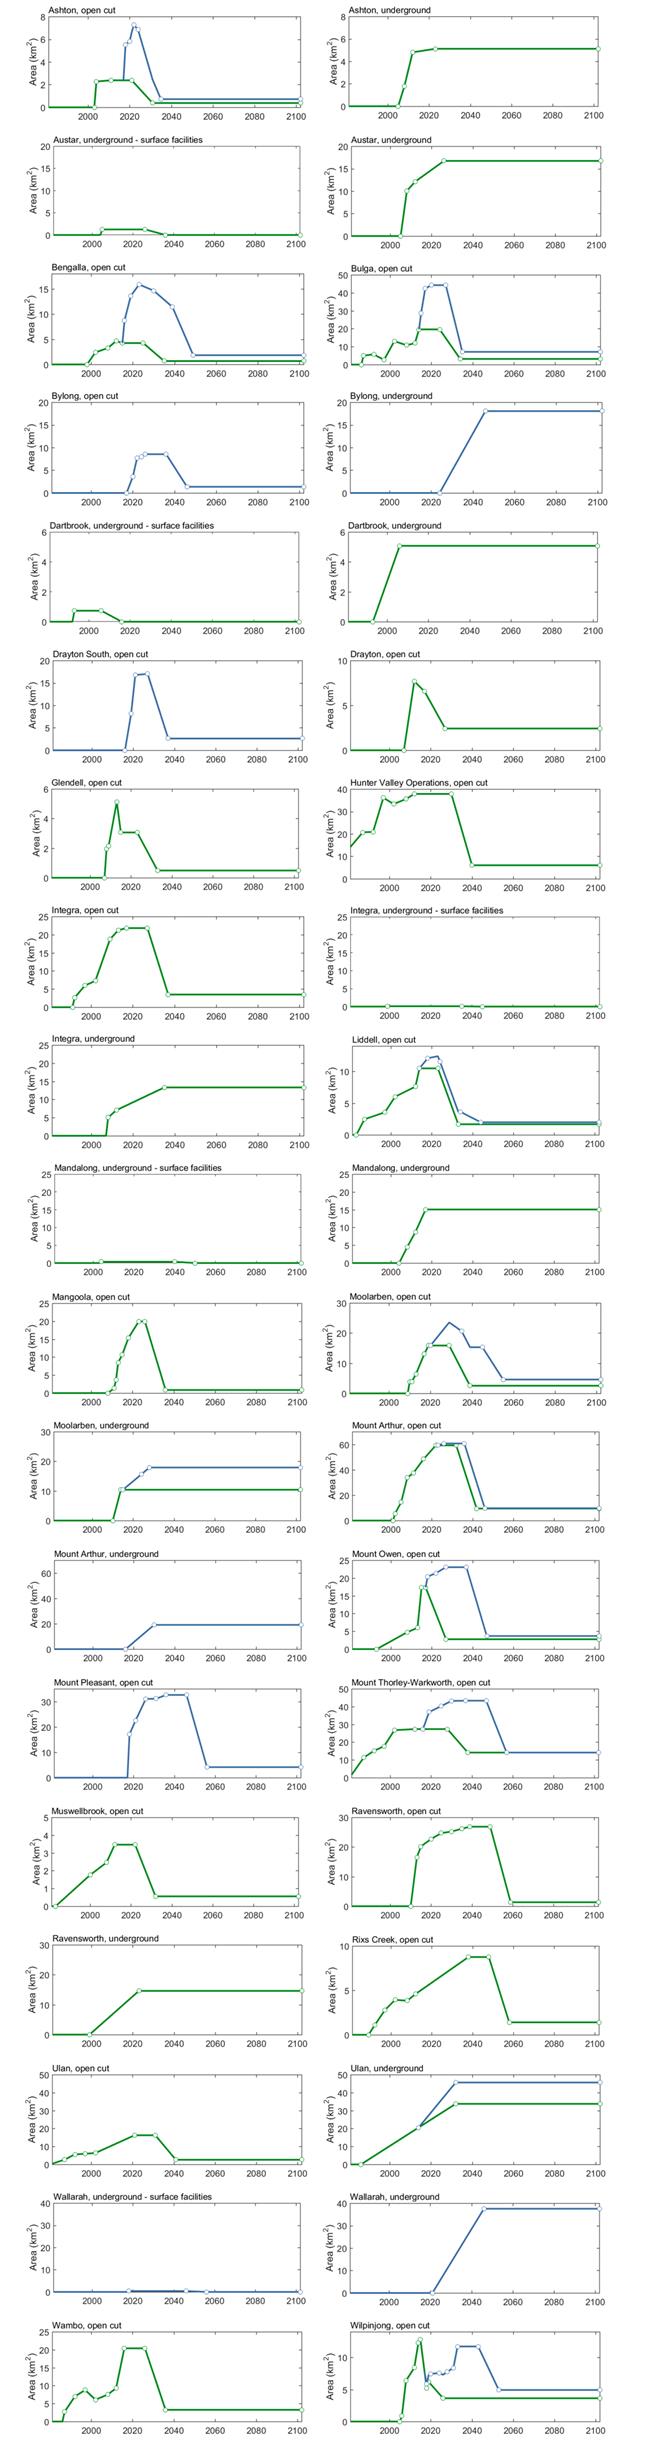
Green = baseline, blue = CRDP mines; lines are interpolations between data points, represented by open circles
Data: Bioregional Assessment Programme (Dataset 1, Dataset 2, Dataset 3, Dataset 4, Dataset 21
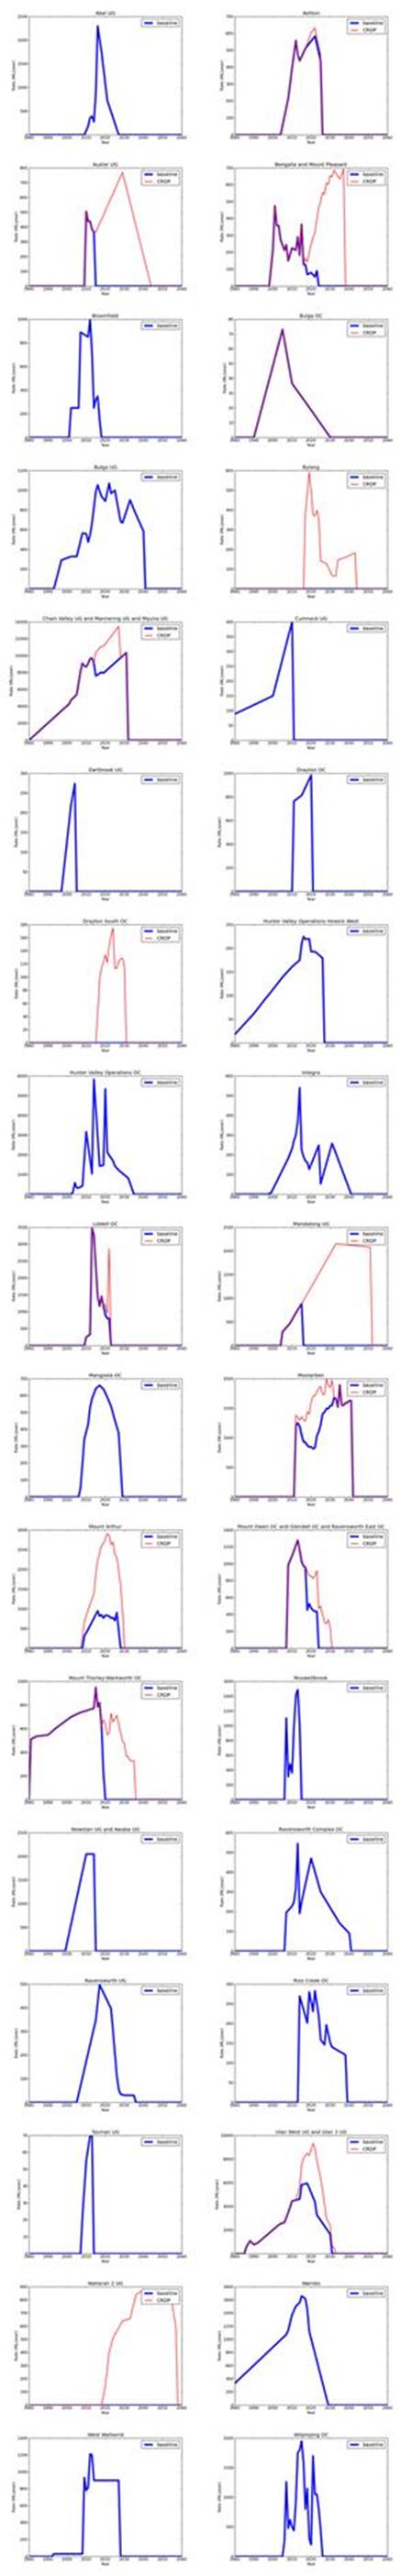
Mount Arthur UG was approved in 2008 and expected to start in 2009, which would have made it a baseline development. As mining did not commence prior to December 2012, it was classified as an ACRD. However, it was incorrectly modelled as starting in 2008. Where time series is composite of a number of mine workings, the maximum flow rate on the graph is not necessarily equal to the sum of the maxima of the individual workings given in Table 23 due to the maxima occurring in different years.
Data: Bioregional Assessment Programme (Dataset 22; Dataset 23; Dataset 24; Dataset 25)
