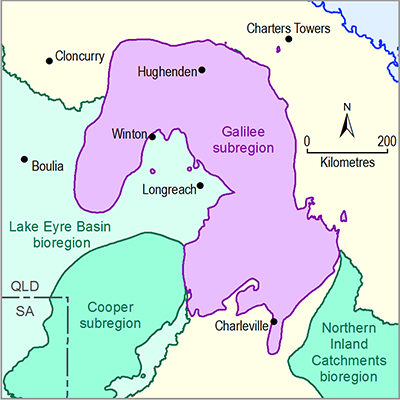
Section 2.6.1.6 summarises the prediction results for eight hydrological response variables at 61 surface water model nodes. The eight hydrological response variables for streamflow are:
- AF – the annual flow volume (GL/year). This is the maximum value over the 90-year period (from 2013 to 2102)
- IQR – the interquartile range in daily flow (ML/day); that is, the difference between the daily streamflow rate at the 75th percentile and at the 25th percentile. This is the maximum value over the 90-year period (from 2013 to 2102)
- P99 – the daily flow rate at the 99th percentile (ML/day). This is the maximum value over the 90-year period (from 2013 to 2102)
- FD – the number of high-flow days per year. This is the maximum value over the 90-year period (from 2013 to 2102). The threshold for high-flow days is the 90th percentile from the simulated 90-year period (2013 to 2102). In some early products, this was referred to as ‘flood days’
- ZFD – the number of zero-flow days per year. This is the maximum value over the 90-year period (from 2013 to 2102)
- LFD – the number of low-flow days per year. This is the maximum value over the 90-year period (from 2013 to 2102). The threshold for low-flow days is the 10th percentile from the simulated 90-year period
- LFS – the number of low-flow spells per year. This is the maximum value over the 90-year period (from 2013 to 2102). A spell is defined as a period of contiguous days of streamflow below the 10th percentile threshold
- LLFS – the length (days) of the longest low-flow spell each year. This is the maximum value over the 90-year period (from 2013 to 2102).
A ninth hydrological response variable defined in companion submethodology M06 (as listed in Table 1) for surface water modelling (Viney, 2016) – the daily streamflow rate at the 1st percentile (P01) – is excluded from the analysis. The P01 flow is not reported because all of the P01 observations are zero for the Galilee subregion.
For each of these hydrological response variables a time series of annual values is constructed for each model node.
For each model node, 10,000 sets of randomly selected parameter values were used to generate 10,000 replicates of development impact. A filter was applied to remove model runs in which future flow increases were due to overestimated streamflow persistence in the decades following the 2010–2011 floods. This reduced the number of replicates for result analyses to 3463. From these, the best 10% of total model replicates for each hydrological response variable, as assessed by their ability to predict that hydrological response variable at the observation sites, were chosen for further analysis.
Results are presented using a series of bar graphs for each hydrological response variable. Each bar graph was generated from the resulting 347 samples. The bar graphs show the distributions over the 347 replicates of the maximum raw change (amax) in each metric between the baseline and coal resource development pathway (CRDP) predictions, the corresponding maximum percentage change (pmax) and the year of maximum change (tmax). In general, the most meaningful diagnostic for the flux-based metrics (AF, IQR, P99 and FD) will be pmax, while the most meaningful diagnostic for the frequency-based metrics (ZFD, LFD, LFS and LLFS) will be amax. It is important to recognise that the amax and pmax values give the largest annual departure between the baseline and CRDP predictions for the respective hydrological response variables. As such, amax and pmax represent extreme responses. They do not represent the magnitudes of responses that would be expected to occur every year. The bar graphs show the distributions of these predictions of maximum impact from among the 347 replicates.

