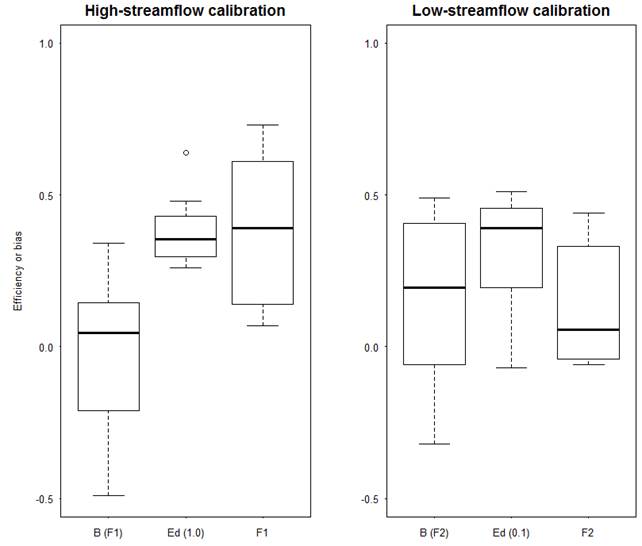
Figure 11 and Table 5 summarise regional model calibration performance for the eight calibration catchments. For both high-streamflow and low-streamflow calibrations, three metrics (F value, daily efficiency and model bias) are shown and their details are explained in the notes of Figure 11 and in Viney (2016).
The high-streamflow calibration yields slightly better results in terms of model bias, indicated by a mean bias of –2% and a median bias of 5%. Overall, the model under-predicts streamflow at three of the eight calibration sites and slightly over-predicts at the remaining five. In terms of Nash–Sutcliffe efficiency (denoted as E) of daily streamflow (Ed(1.0)), the high-streamflow calibration yields somewhat satisfactory results, indicated by mean and median Ed values of 0.38 and 0.36, respectively.
The low-streamflow calibration is evaluated against the daily streamflow data transformed with a power of 0.1, or a Box-Cox lambda value of 0.1 (Box and Cox, 1964), which can ensure the model evaluation is putting more weight on low streamflow than on higher streamflow. The low-streamflow calibration has a stronger tendency towards over prediction with a median bias of 20%. In terms of efficiency, the low-streamflow calibration yields similar results to high-streamflow calibration, indicated by mean and median Ed values of 0.32 and 0.39, respectively. The low-streamflow calibration is poor at gauging site 002105, but is satisfactory elsewhere.
The eight calibration catchments cover a wide range of climate and topographic conditions, where mean annual streamflow varies from 7 mm/year at catchment 003302 to 78.6 mm/year at catchment 915013 (Table 5). This indicates that the Australian Water Resources Assessment landscape model (AWRA-L) is suitable to predict streamflow in the Galilee subregion where climate conditions vary widely. Furthermore, the performance of the high-streamflow calibration for the eight catchments is not significantly related to catchment wetness, as it does not perform better with a wetter climate.
Figure 11 Summary of two AWRA-L model calibrations for the Galilee subregion
In each boxplot, the bottom, middle and top of the box are the 25th, 50th and 75th percentiles, respectively, and the bottom and top whiskers are the 10th and 90th percentiles, respectively. F1 is the F value for high-streamflow calibration; F2 is the F value for low-streamflow calibration; Ed(1.0) is the daily efficiency with a Box-Cox lambda value of 1.0; Ed(0.1) is the daily efficiency with a Box-Cox lambda value of 0.1; and B is model bias (Viney, 2016). AWRA-L = Australian Water Resources Assessment landscape model
Data: Bureau of Meteorology: forcing data (Dataset 1) and streamflow data (Dataset 2)
Table 5 Summary of model calibration for the eight gauged catchments in the Galilee subregion
aF1 is the F value for high-streamflow calibration (see Viney, 2016); bF2 is the F value for low-streamflow calibration
Ed(1.0) is the daily efficiency with a Box-Cox lambda value of 1.0; Ed(0.1) is the daily efficiency with a Box-Cox lambda value of 0.1.
Data: Bureau of Meteorology: forcing data (Dataset 1) and streamflow data (Dataset 2)
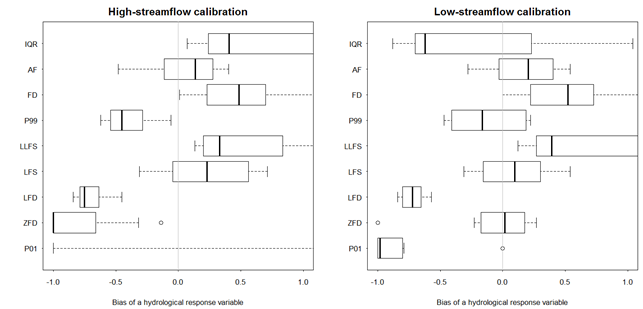
Figure 12 shows the performance of the two calibration schemes (high-streamflow calibration and low-streamflow calibration) for predicting nine hydrological response variables (details for each hydrological response variable are shown in Table 6). The high-streamflow calibration yields relatively better (i.e. less biased) predictions for annual flow (AF) while the low-streamflow calibration yields better predictions for low-flow spells (LFS) and zero-flow days (ZFD). The two calibration sets yield predictions with similar levels of bias for interquartile range (IQR), flood (high-flow) days (FD) and low-flow days (LFD), though the latter is poorly predicted by both. Curiously, one of the high-flow metrics, daily flow at the 99th percentile (P99), appears to be predicted better by the low-flow calibration, while one of the low-flow metrics, longest low-flow spell (LLFS), appears to be predicted slightly better by the high-flow calibration. The remaining hydrological variable, daily flow at the 1st percentile (P01), is unable to be predicted by either calibration parameter set because most catchments are ephemeral so P01 takes a value of zero in most years at most sites.
Table 6 Summary of nine hydrological response variables for streamflow
Boxplots are obtained from the statistics (Nash–Sutcliffe efficiency and bias) results at the eight calibration catchments. In each boxplot, the left, middle, and right of the box are the 25th, 50th and 75th percentiles, respectively, and the left and right whiskers are the 10th and 90th percentiles, respectively. AWRA-L = Australian Water Resources Assessment landscape model
Data: Bureau of Meteorology: forcing data (Dataset 1) and streamflow data (Dataset 2)
The calibration results summarised in Figure 11 and Figure 12 indicate that neither of the calibration methods are good at predicting all of the hydrological response variables analysed in this Assessment. The main limitation is the lack of a long period of continuously observed streamflow data for model calibration. Stream gauges in the Galilee subregion are sparse and the length of data records is relatively short (less than 25 years). As stated by Viney (2016), it is expected that for most model nodes, the variables P01 and ZFD will be mutually exclusive in that one or the other will produce useful information, but not both. In the Galilee subregion, P01 is unlikely to provide useful predictions in model nodes.


