Interaction between groundwater and surface water in the Galilee subregion is manifested in a variety of ways including:
- interactions between groundwater systems and streams. Streams that may be receiving groundwater discharge include the: Alice, Carmichael, Belyando and Thomson rivers. Surface water flow data are only available for the latter two rivers and these will be discussed in the next two sections. Adani Mining Pty Ltd are collecting information on groundwater discharge and baseflow in the Carmichael River but these data are not available for the bioregional assessment
- leakage of surface water to the Quaternary alluvium in losing streams such as Dunda, Tallarenha and Lagoon creeks. These leakages cannot be quantified due to the lack of data
- groundwater-dependent ecosystems and springs
- discharge to lakes, for example, Lake Galilee, Lake Buchanan and Lake Dunn.
Baseflow refers to the component of stream flow that isn’t directly related to runoff from rainfall events. The baseflow component of streamflow can be derived from a number of sources including: stream bank storage effects due to a high surface water flow event, groundwater discharge from shallow alluvial aquifers, groundwater discharge from deep aquifers (if applicable), and interflow through the unsaturated zone to a river. The baseflow component of a hydrograph (Figure 88) is a mathematical construct derived from streamflow data and can’t necessarily be attributed to a particular source. However, for the purposes of the following discussion, the baseflow component of streamflow is assumed to be derived through fully saturated groundwater discharge from an aquifer to surface drainage. This may provide a theoretical upper estimate of the potential fluxes of groundwater that may occur between a particular river reach and nearby aquifers.
The following sections will focus on the estimation of potential groundwater flux that may occur to some major drainage lines, in particular the Belyando River and Thomson River. Source aquifers for the various spring groups are discussed in Section 2.1.3. No data were available to assess the degree of surface water – groundwater interactions for lakes in the subregion. Some conceptualised understandings for the lakes and springs are presented in Section 2.3.2 of companion product 2.3 for the Galilee subregion (Evans et al., 2018) and in companion product 3‑4 for the Galilee subregion (Lewis et al., 2018).
2.1.5.2.1 Estimate of groundwater flux to the Belyando River
The Belyando River is found near the eastern margin of the Galilee subregion, in the upper part of the eastward draining Burdekin river basin. Its flow is characterised by high discharges in response to large rainfall events followed by long periods of virtually no flow. The Belyando River hydrograph, however, exhibits significant baseflow recession as shown in Figure 88, and baseflow may persist for up to two months after a high-flow event. These high-flow events usually occur during the summer months.
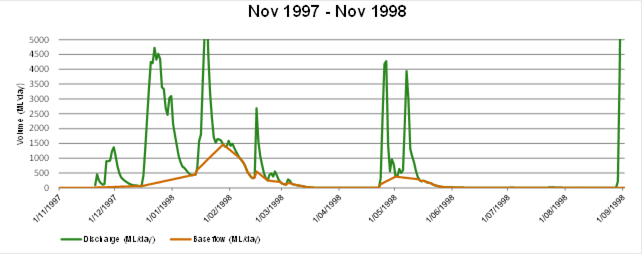
Figure 88 Example hydrograph of Belyando River at Belyando Crossing showing baseflow recession
Baseflow is calculated by the baseflow separation program developed by the Institute of Hydrology (Wallingford, UK) – Tallaksen and van Lanen (2004).
The baseflow component of a hydrograph can include surface water flow derived from a number of sources, including discharge of groundwater from an aquifer. For the purposes of Section 2.1.5 it is assumed that all baseflow equates to groundwater discharge from an aquifer.
Data: Queensland Department of Natural Resources and Mines (Dataset 1)
The hydrograph in Figure 88 is from the gauge at Belyando Crossing, 75 km downstream of the Galilee subregion, where the Gregory Development Road crosses the river. Flow records exist from 1976 to the present. The baseflow recession components shown in Figure 88 were calculated by the baseflow separation program developed by the Institute of Hydrology (Wallingford, UK) (Tallaksen and van Lanen, 2004). This method of determining baseflow estimates baseflow volumes by dividing a daily flow record into overlapping three day time steps, and making linear interpolations between observations of flow minima in each time step of the record. Flow minima are only used in determining the baseflow line on the hydrograph where 0.9 × the central daily flow value of the time step is less than both outer values of the time step. Additionally, if linear interpolation between two minima observed on the baseflow line would result in baseflow estimates greater than the total streamflow for a given day, the baseflow estimate for that day is adjusted to be equal to the total streamflow. This method does not require the assumption of coefficients used to calculate baseflow in other baseflow separation techniques. The Wallingford program also calculates the baseflow index (BFI) of the river on a seasonal or annual basis. Figure 89 shows the BFIs calculated on a (wet) seasonal and annual basis using flow data from 1976 to 2012.
A couple of features shown in Figure 89 deserve comment. Firstly, there is considerable variation from year to year in both the wet season and annual BFIs. Secondly, for about two-thirds of the years, the wet season BFI exceeds the yearly BFI. This must mean that low winter rainfall events generate little baseflow. According to the Wallingford program, the mean annual BFI for the 35 years of recording is 0.127. Given a mean annual flow of 657,060 ML/year for the Belyando River at Belyando Crossing (Prendegast and Davidson, 2014), this equates to a mean annual baseflow of about 83,450 ML/year.
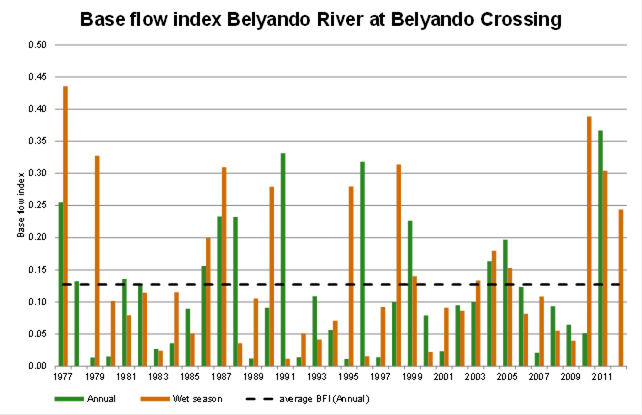
Wet season = November to February
The BFI is the ratio of baseflow to total river flow. The baseflow component of a hydrograph can include surface water flow derived from a number of sources, including discharge of groundwater from an aquifer. For the purposes of discussion in Section 2.1.5 it is assumed that all baseflow equates to groundwater discharge from an aquifer.
Data: Queensland Department of Natural Resources and Mines (Dataset 1)
A proportion of the baseflow measured at Belyando Crossing is generated within the Galilee subregion. It is necessary to determine the proportion of this flow that may be affected due to large-scale dewatering of the coal seams. A significant assumption here is that baseflow, as outlined in Figure 88 and Figure 89 is derived solely through the discharge of groundwater from aquifers.
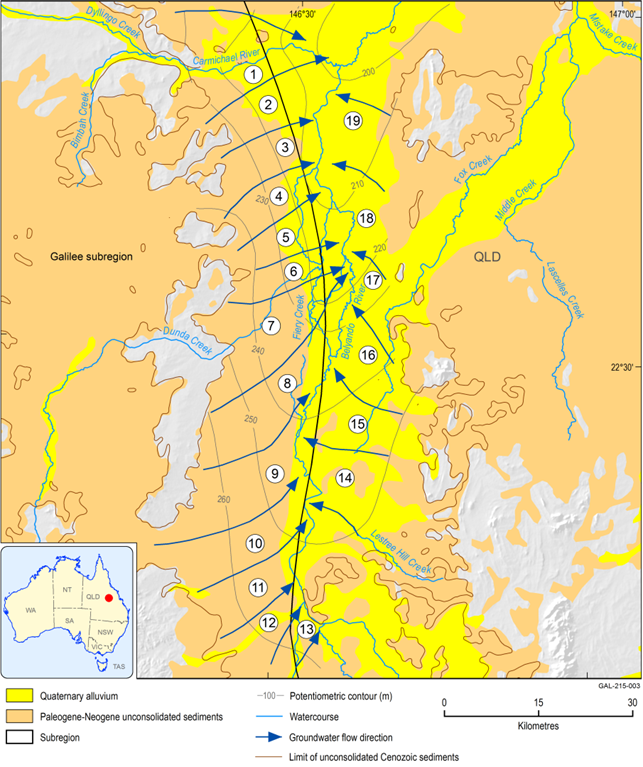
Figure 90 is a subset of Figure 56 in Section 2.1.3.2.2.2 and shows the potentiometric surface of the combined Quaternary alluvium and unconsolidated Paleogene–Neogene sediments in the Belyando river basin. The flow lines define boundaries between flow elements, numbered from 1 to 19 in Figure 90. The groundwater flux through each element may be computed using Darcy’s Law; in these calculations it is assumed the hydraulic conductivity of the Cenozoic sediments is 1.5 m/day (the mean Kh value of the Quaternary and Paleogene–Neogene sediments) and the saturated thickness is 70 m. Calculated groundwater fluxes for each element are shown Table 26. These data indicate that only 9.5% of the total baseflow measured at Belyando Crossing is generated within the Galilee subregion.
For the initial estimate of groundwater flux as outlined in Table 26 (and Table 27), a number of conservative assumptions were made. Assumptions and limitations on the calculations include that:
- the baseflow estimate at the Belyando River crossing is applicable to reaches of the Belyando River that are located some 75 km upstream from the stream gauge
- all baseflow occurs under fully saturated conditions (i.e. no interflow or bank storage) and that it only equates to groundwater flux between a river and an aquifer
- Quaternary alluvium and underlying Paleogene–Neogene sediments have unimpeded hydraulic connection
- there is connection between underlying upper Permian coal measures (Bandanna Formation or Colinlea Sandstone) and overlying Cenozoic sediments
- the mean saturated thickness of unconfined shallow aquifers in Cenozoic sediments is 70 m
- the mean horizontal hydraulic conductivity is 1.5 m/day
- the aquifer in the Cenozoic sediments is homogenous and isotropic in every flow element
- the hydraulic flux calculated for each flow element identified in Figure 90 fully discharges to the river. So for instance, there is no discharge via evapotranspiration from deep rooted vegetation (e.g. redgums, coolibah), or pumping of groundwater
- no groundwater underflow occurs in the flow element areas
- the river is always a gaining stream
- the effect of yearly climatic variations on groundwater levels in shallow aquifers are not taken into account
- potentiometric surfaces for Cenozoic aquifers (Figure 90, Figure 92) are not derived from measurements of groundwater levels at a specific point in time as very limited time series groundwater level data exists (see Section 2.1.3.3.3 for detail). Available water level measurements are often only a single measurement taken at different times of the year. Thus the potentiometric surfaces for the Cenozoic aquifers are more representative for potential flow trends. However, as outlined in Section 2.1.3.3.3, yearly fluctuations and trends are well within the 10 m contour intervals shown on the potentiometric surfaces.
Not all of the assumptions outlined above are likely to be met in the Belyando river basin. For instance, pumping bores do occur in these areas and there is significant seasonal climatic variation. Also, it is highly likely that over such a large area, there would be significant variation in hydraulic parameters, for example, hydraulic conductivity, which in turn will affect calculations for groundwater flux and localised distribution of flow potentials and hydraulic gradients. Consequently, these results represent a first pass estimate only and due to all the assumptions should be considered to be conservative. Essentially more site-specific data and other approaches would be required to crosscheck the estimate and the validity of the assumptions. Other data that would be of use include groundwater and surface water chemistry and isotopic data with samples acquired as part of one field visit.
Data: Bioregional Assessment Programme (Dataset 2, Dataset 3)
Table 26 Groundwater fluxes in Cenozoic sediments which contribute to Belyando River baseflow
Data: Bioregional Assessment (Dataset 2)
Large drawdowns will need to be generated in the upper Permian coal measures in order to develop the proposed coal mines. It is conceptually possible that to some degree downwards leakage from the Cenozoic sediments will be induced into the upper Permian coal measures, which could result in a reduction to baseflow. The current best estimate of baseflow to the Belyando River in the subregion is 7950 ML/year, which represents less than 10% of the total streamflow at the Belyando Crossing gauge.
2.1.5.2.2 Baseflow to the Thomson River
The Thomson River lies in the Cooper Creek-Bulloo river basin. The Thomson River flows through Longreach and is the major stream draining the central part of the Galilee subregion. The Thomson River is not a single channel, but like the other major rivers of western Queensland, is strongly anastomosed with up to several parallel braided channels entrenched deeply in alluvial belts 3 to 5 km wide. The riverbed contains many elongated waterholes, some of which contain permanent water. The mean annual discharge based on 40 years (1970–2010) of records from the gauge at Longreach is 1,246,600 ML/year. The Thomson River is believed to be underlain by a paleochannel of Cenozoic age (Ransley and Smerdon, 2012) which is incised into the underlying Winton-Mackunda formations to a depth of up to 200 m. Like the Belyando River, flow in the Thomson River is characterised by high discharges in response to large rainfall events interspersed with long periods of virtually no flow. However, bed underflow in the paleochannel sediments is likely to continue indefinitely.
The annual BFI (Figure 91) estimated from the Wallingford program is 0.180 giving a mean annual baseflow estimate of 224,390 ML/year.
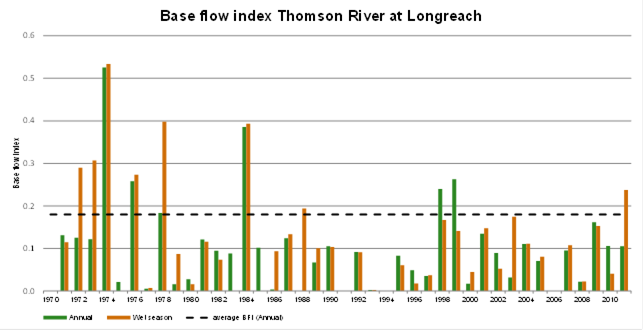
Figure 91 Baseflow index (BFI) values for the Thomson River at Longreach for 40 years of records
Wet season = November to February
The BFI is the ratio of baseflow to total river flow. The baseflow component of a hydrograph can include surface water flow derived from a number of sources, including discharge of groundwater from an aquifer. For the purposes of discussion in Section 2.1.5 it is assumed that all baseflow equates to groundwater discharge from an aquifer.
Data: Queensland Department of Natural Resources and Mines (Dataset 1)
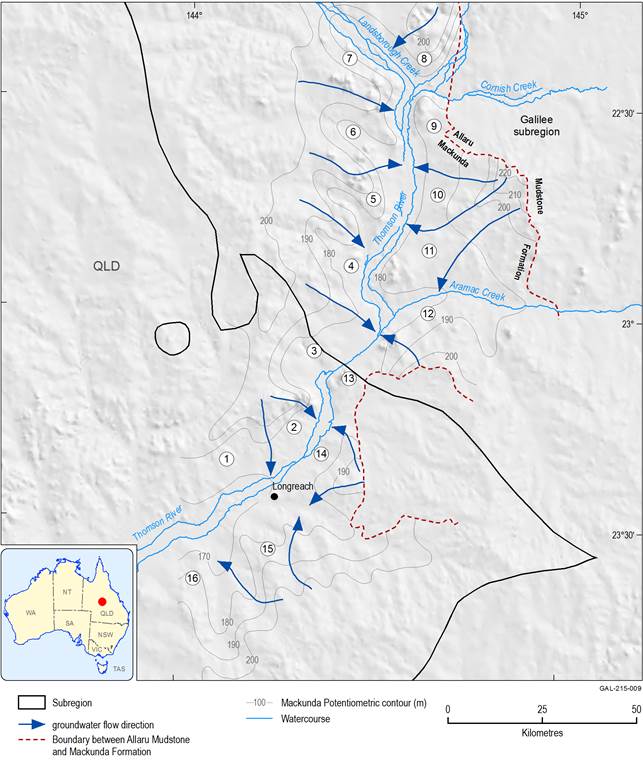
Like the Belyando River BFIs, the Thomson River BFIs display considerable year-to-year variation, the years 1974 and 1984 in particular. Figure 92 is a subset of Figure 57 in Section 2.1.3.2.2 and shows the watertable in the Winton-Mackunda formations on the Longreach and Muttaburra 1:250 000 map sheets. The flow lines shown in Figure 92 define boundaries between flow elements numbered from 1 to 16, which shows the potentiometric surface for the Winton-Mackunda aquifer. Using the same assumptions and approach as undertaken for the Belyando River analysis (Section 2.1.5.2.1), the groundwater flux through each numbered flow element in Figure 92 is computed using Darcy’s Law; in these calculations it is assumed the hydraulic conductivity of the Winton-Mackunda formations is 1 m/day and the aquifer’s saturated thickness is 469 m. The same assumptions that were applied to the Belyando River example, apply to the Thomson River example. It should be stressed that this is an estimate only based on idealised conditions. Estimated groundwater fluxes for each element are shown in Table 27. These results represent a first pass estimate only and due to all the assumptions is likely to be highly conservative.
These data indicate that 72.9% of the total baseflow in the Thomson River at Longreach is generated by upward leakage and lateral seepage from the Winton-Mackunda formations aquifer between Longreach and Muttaburra. The dominant mechanism is possibly lateral seepage to the paleochannel alluvium since formation of the paleochannel would have eroded through the weathered sections of the Winton-Mackunda formations. The erosion may have resulted in direct unimpeded hydraulic connection between the alluvium and fresh rock.
Moya et al. (2014) reinterpreted some seismic and borehole data for central portions of the Galilee Basin, and discovered a previously unknown major fault that runs parallel with the Thomson River in the vicinity of Longreach. These authors named this structure the Thomson River Fault and measured a vertical displacement of up to 650 m along the fault plane (uplifted on the eastern side). They further speculated that the Thomson River Fault may act as a conduit for vertical upwards transmission of groundwater from the Cadna-owie—Hooray aquifer to discharge into the Thomson River alluvium.
Conceptually, baseflow to the Thomson River could be comprised of:
- upward leakage from the Hooray Sandstone upstream of Muttaburra (along Landsborough, Towerhill and Cornish Creeks)
- upward leakage from the Hooray Sandstone along the lower Aramac Creek
- upward leakage from the Hutton Sandstone along the Thomson River Fault, and along Aramac, Landsborough and Cornish Creeks (not as large as the upward leakage from the Hooray Sandstone)
- lateral seepage from the Cenozoic sediments of the alluvial belts
- a combination of upward leakage along the Thomson River Fault and lateral seepage into the alluvium of the Thomson River paleochannel from the Winton-Mackunda formations.
Data: Bioregional Assessment Programme (Dataset 2, Dataset 3)
Table 27 Groundwater fluxes in the Winton-Mackunda formations partial aquifer which contribute to Thomson River baseflow
Data: Bioregional Assessment Programme (Dataset 2)
