2.1.2.1.1 Overview
This product outlines the rationale for the development of a geological model of the Galilee subregion. It details the data used in its construction, and the known limitations of certainty to this data. The geological model is presented as maps of various sedimentary sequences, with the extent, regional orientation and thickness of each package defined sufficiently to generate a three-dimensional representation of the geology of the Galilee subregion.
Knowledge of the geological architecture of the Galilee subregion is essential as a framework for conceptualising the hydrogeology of the Galilee and Eromanga basins as well as providing a framework for surface water - interactions.
There are three main types of observed geological data available:
- drillhole data
- geophysical data
- geological maps and models.
2.1.2.1.2 Drillhole data
Several sources of drillhole data and other related information were accessed for the BA for the Galilee subregion. These data are from three Queensland Department of Natural Resources and Mines (DNRM) sources:
- Queensland groundwater database
- Queensland Petroleum Exploration Database (QPED)
- well completion reports from the Queensland digital exploration reports (QDEX).
From publicly available bore data (Bureau of Meteorology, Dataset 1) in total some 7350 bores have been drilled in the Galilee subregion for groundwater, petroleum, CSG or stratigraphic purposes.
As of December 2013, there were 321 petroleum, CSG and stratigraphic wells in the Galilee subregion comprising some 202 wells for petroleum and CSG, and 119 stratigraphic drillholes (Figure 6 and Table 4). A slight increase in well density is evident in the southern Galilee subregion near the Gilmore gas field, and in the central portions of the northern Galilee Basin, which is the main area of focus for CSG exploration.
More information can be obtained for petroleum, CSG and stratigraphic wells from their original well completion reports. The Queensland groundwater database contains the most publicly available groundwater bore data. Government agencies drilled some regional coal exploration bores in the 1960s through to the 1970s.
As of July 2014, 7029 groundwater bores had been drilled in the Galilee subregion (Bureau of Meteorology, Dataset 1). Of these, 4712 were currently classed as operational in companion product 1.5 for the Galilee subregion (Evans et al., 2015). Figure 5 through to Figure 8 in companion product 1.5 for the Galilee subregion (Evans et al., 2015) show the distribution of operational groundwater bores in the Galilee subregion.
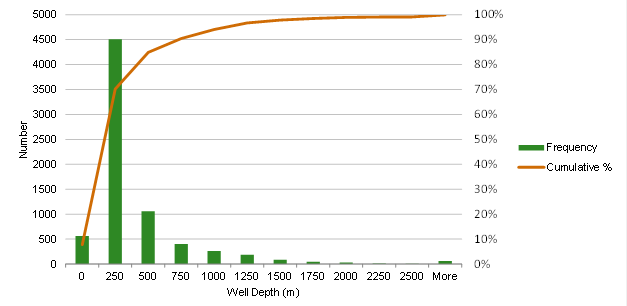
It is important to note that within the Galilee subregion, some 560 bores (approximately 8% of total) have no available depth information (Figure 7). The drillholes missing depth information are almost all groundwater bores. Figure 7 also highlights the considerable variation in bore depth, which is partially dependent on the original purpose of a bore. While some groundwater bores can be up to 1500 m deep, most groundwater bores (approximately 87%) are less than 500 m deep. Groundwater bores greater than 500 m in depth target deep artesian aquifers in the Eromanga Basin. Bores greater than 1500 m in depth are almost exclusively exploration wells that target petroleum reservoirs in the Galilee Basin or the underlying Adavale Basin. CSG wells target coal seams in the Galilee Basin and range in depth from approximately 600 to 1500 m.
Company groundwater monitoring bore data is available through the Queensland groundwater database. However, company drillhole data for mineral and coal exploration are not readily available in a digital format to the public. It is likely that hundreds, if not thousands, of coal resource appraisal bores have been drilled in the Galilee subregion. The majority of the bores drilled by industry cluster around the known coal resource project areas, in particular those projects located along the eastern margin of the Galilee subregion (Figure 6). It is likely that the incorporation of company coal drillhole data would significantly refine geological models for the subregion, in particular the modelled geological surfaces for the Galilee Basin. Such refinements would improve understanding of the geological architecture and potential connective pathways.
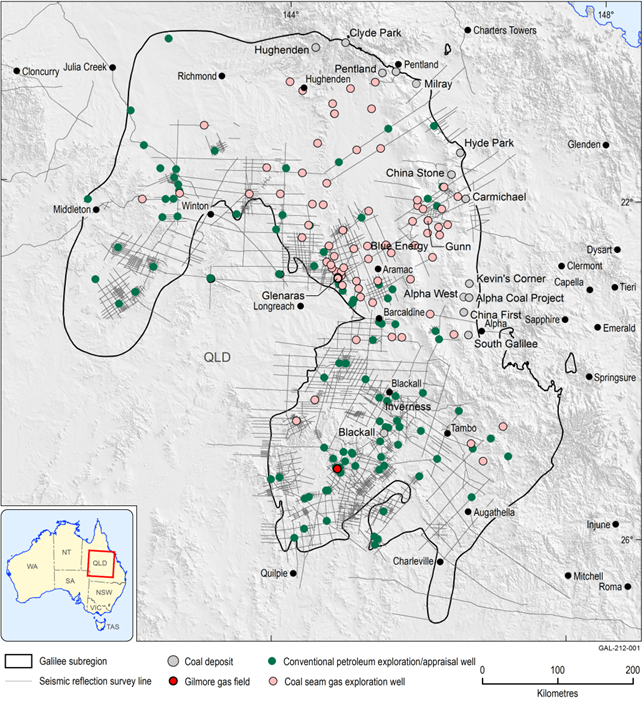
Gilmore gas field is situated in the Adavale Basin, which underlies the Galilee Basin. This Gilmore gas field is a conventional gas field that is not associated with coal or CSG.
Data: Bureau of Meteorology (Dataset 1), Geological Survey of Queensland (Dataset 2), Bioregional Assessment Programme (Dataset 3, Dataset 4, Dataset 7), Queensland Department of Natural Resources and Mines (Dataset 5, Dataset 6)
Data: Bioregional Assessment Programme (Dataset 8)
2.1.2.1.3 Geophysics
Numerous geophysical surveys have been undertaken in the Galilee subregion over the last 60 years. The regional geophysical datasets include ground-based gravity measurements, airborne aeromagnetics and radiometrics, and two-dimensional seismic reflection surveys.
2.1.2.1.3.1 Gravity and magnetics
Airborne magnetics and radiometrics survey data and ground-based gravity measurements were obtained from the geophysics archive and data delivery system (GADDS; Geoscience Australia, 2015). Numerous surveys of varying quality, configuration and extent exist across the subregion, Relevant data from some of these surveys have been combined into a consistent framework on a continent-wide basis for Bouguer gravity (Geoscience Australia, 2015), aeromagnetics and radiometrics (Geoscience Australia, 2015). There will be no further discussion on radiometrics as this data type was not used as part of this iteration of the BA for the Galilee subregion. Radiometrics could be used in future studies to refine surface geological mapping, which may in turn be used to refine estimates of recharge to groundwater systems.
Gravity and magnetic potential field data provide a consistent regional coverage that can be used to delineate regional structural fabric, provide infill for gaps in other datasets, and help to substantiate interpretation between existing seismic lines and drillhole data. A composite image of gravity (in colour) and magnetics is shown in Figure 8. This combined data image can be used to help delineate the distribution and thickness of sedimentary cover, as well as changes in basement lithology and structure.
The Galilee subregion overlaps an area of active research on basement character and tectonics (e.g. Spampinato et al., 2015a, 2015b, 2015c). Subsequent movement along many pre-existing faults in geological basement (e.g. Cork Fault, Wetherby Structure, and Hulton-Rand Structure) have disrupted overlying Galilee and Eromanga basin sequences.
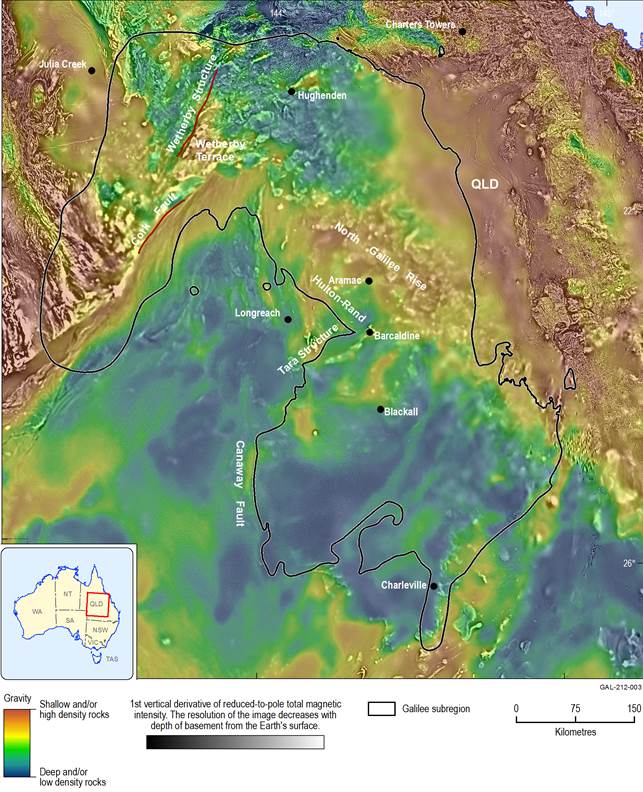
Figure 8 Composite potential field (gravity and aeromagnetics) image for the Galilee subregion
Structural trends in basement are indicated from composite potential field data. Gravity (in colour) indicates a combination of depth and density of basement. Magnetics (total magnetic intensity (TMI), reduced to pole and 1st vertical derivative) in sun-shaded monochrome highlights the structural character of the geological basement as well as its depth from surface.
Data: Geoscience Australia (Dataset 9), Bioregional Assessment Programme (Dataset 10)
2.1.2.1.3.2 Seismic
Seismic data can be used to extend and correlate stratigraphic surfaces between drillhole stratigraphic controls to provide a more regional coverage. Since the late 1950s, companies and government agencies have acquired two-dimensional seismic reflection survey data across the Galilee subregion. More recent seismic reflection surveys have been conducted as part of regional exploration programmes for CSG as well as deep crustal studies by Geoscience Australia. From the distribution of two-dimensional seismic reflection survey lines (Figure 6) it is apparent that the northern and eastern margins of the Galilee subregion have sparse to non-existent coverage. Marsh et al. (2008) reviewed available seismic and well data in the Galilee subregion as part of studies into the storage of carbon dioxide (CO2). They found that although seismic coverage was relatively abundant in some areas of the Galilee subregion, much of the seismic data was not available in a readily usable format. Other issues include variable quality in resolution of the seismic and location data.
Existing publicly available seismic horizon mapping from reports (Queensland Department of Natural Resources and Mines, Dataset 6; Bioregional Assessment Programme, Dataset 7) was utilised in the development of the Galilee Basin geological surfaces and model (Section 2.1.2.2.4).
2.1.2.1.4 Geological maps and models
The surface geology of the Galilee subregion was systematically mapped during the 1960s and 1970s and resulted in a series of maps (Figure 10) being published at a scale of 1:250,000 (1 cm = 2.5 km). These maps defined the surface distribution of stratigraphic units, regional structures, bores and other features as well as incorporating information from geophysical surveys that existed at the time. Several surface geology datasets at smaller scales, for example 1:1,000,000 (1 cm = 10 km), are derived from the original 1:250,000 regional mapping. References for the 1:250,000 map sheets are detailed in Table 3.
Recently, more detailed larger-scale maps at a 1:100,000 scale (1 cm = 1 km) have been published for selected areas along the eastern margin of the Galilee subregion. There are notable discrepancies in the occurrence and distribution of Galilee Basin stratigraphic units at the different scales of geological mapping. For instance on the Mt Tutah 1:100,000 map sheet (DME, 2008) there occurs outcrop of Galilee Basin sedimentary rocks whereas some of these outcrop areas are not shown on the equivalent 1;250,000 map sheet (Buchanan 1;250,000 map sheet (Olgers, 1970)). Some of the implications of these discrepancies are further discussed in companion product 3-4 for the Galilee subregion (Lewis et al., 2018).
2.1.2.1.4.1 Updated stratigraphic column
Since the publication of the original stratigraphic column in companion product 1.1 for the Galilee subregion (Evans et al., 2014), new work has been published that refines the understanding of the stratigraphy in the subregion. The refinements as shown on Figure 9 include:
- addition of the Precipice Sandstone and Evergreen Formation. The recent publication of the GAB Atlas (Ransley et al., 2015) demonstrates that equivalents of these formations are present in the Lovelle and Powell depressions of the Galilee subregion
- minor refinements to the Cenozoic sections of the Galilee subregion stratigraphic column
- new uranium-lead zircon dates that pinpoint the age of deposition for the Edie Tuff Member to 294.8±0.08 Ma Nicoll et al., 2015). These precise age dates, coupled with an improved understanding of biostratigraphy of the Aramac Coal Measures, have compressed the depositional time interval for lower Permian sequences in the Galilee Basin by some 8 to 10 million years.
Ongoing work as outlined in Nicoll et al. (2015) and Phillips et al. (2015, 2016) will further refine the Permian stratigraphy and geological understanding of the Galilee Basin. This may result in future updates to the Galilee subregion stratigraphic column.
2.1.2.1.4.2 Existing geological models
Several existing geological models have been used as a basis for the development of the Galilee subregion geological model.
Structure in basement has been modelled by de Vries et al. (2006) as a continent-wide OZ SEEBASE surface. While OZ SEEBASE addresses magnetic basement, which is itself subject to interpretation, it does offer a regional template for interpretation of basement depth and structure across the Galilee subregion that can be better constrained with use of more recent seismic and drillhole data.
The hydrostratigraphic architecture of the GAB has recently been defined by Ransley et al. (2015). Their approach categorises stratigraphic packages as regional aquifers and aquitards as a way to conceptually simplify the hydrogeological understanding of a myriad of lithostratigraphic units. For the Galilee subregion, the isopach maps of hydrostratigraphic units offer a basis for developing a consistent stratigraphic model of the Jurassic to Cenozoic sequence.
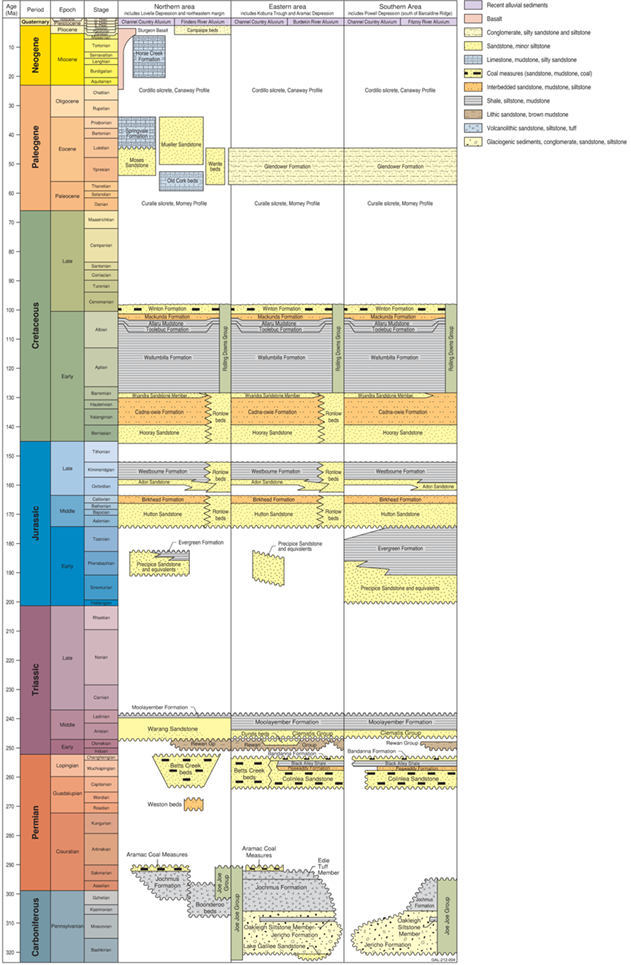
Figure 9 Updated stratigraphic column for the Galilee subregion
Updated stratigraphic column compiled from companion product 1.1 for the Galilee subregion (Evans et al., 2014) and McKellar and Henderson (2013)
2.1.2.1.5 Geological uncertainty
The confidence in understanding subsurface geology in the Galilee subregion is primarily a function of density and quality of the acquired geophysics and drillhole data in combination with the surface geological mapping.
Each of the 1:250,000 geological maps (Figure 10) has an associated reliability diagram that outlines in general terms which areas of each map sheet were mapped in detail. Mapping with greater reliability usually equates to higher field traverse density and good air photo coverage. For this 1:250,000 mapping programme, on-ground geological mapping tended to focus on areas of pre-Cenozoic outcrop. Areas of lower reliability usually equate to those regions covered by Cenozoic sediments. The areas of significant Cenozoic cover can be ascertained from Figure 10. Further detail on the geology and relative uncertainty can be found in the geological notes (references outlined in Table 3) that accompany each 1:250,000 map sheet. Discrepancies in the surface geological mapping, such as those outlined in Section 2.1.2.1.4, would contribute to geological uncertainty, as surface geological mapping is a key input dataset to any geological modelling and conceptualisation.
2.1.2.1.5.1 Drillhole data and uncertainty
Available drillhole databases are largely archival in nature with data derived from a range of sources. The main types of data required from drillhole datasets to build various geological models for BAs are stratigraphic picks and bore location data. The discussion here will focus on these aspects.
In terms of the data, it is difficult to assess inherent uncertainty on a per bore basis. Data quality can vary considerably from bore to bore, and is partially dependent on: the original purpose for which the bore was drilled (e.g. groundwater, coal or petroleum); when the bore was drilled (data vintage); how the bore was drilled (drilling operations and type of drilling); the care with which data were collated and reported; the relative experience of the well site geologist and other personnel; and if other types of data collected during drilling of the bore can be used for comparison and to cross check results (e.g. downhole geophysics logs, biostratigraphy, lithological samples).
In general, stratigraphic and positioning data for petroleum, CSG and stratigraphic wells represent the higher quality datasets because usually a more methodical and consistent approach was taken in collecting multiple types of data from each well. There is also usually enough detailed information to corroborate the stratigraphic picks, which were derived from the various datasets (e.g. geophysical well logs, detailed lithology, biostratigraphy). If stratigraphic picks need to be re-interpreted then there is usually adequate data available from the bore in question to do so.
There is more variation in the quality of stratigraphic interpretations and bore positioning data with groundwater bores. Sometimes more care is taken in the collection of data from deeper (and more expensive) groundwater bores than those obtained from shallow pastoral bores. The locations of the shallow pastoral bores may not have been surveyed. Interpretation of their stratigraphy is commonly solely from drillers’ logs, rather than from variety of data sources. However, the proportionately much greater number of groundwater bores available offers a better regional coverage if they can be integrated carefully with stratigraphic information from the more reliable deeper stratigraphic and exploration wells.
Data from coal resource appraisal bores are generally of good quality, as they have been collected in a methodical and composite approach. However, these data are commonly not available in the public domain and are therefore not readily available for use in this BA.
Adjoining resource companies may hold divergent views on stratigraphic interpretation and nomenclature. Examples of this problem are outlined in Section 2.1.2.2.5.3 (under ‘Upper Permian coal measures’). Although this is not necessarily an issue for interpreted stratigraphy at a mine scale, such variance can become a significant issue when trying to correlate geological units on a regional scale.
Varying definitions for stratigraphic boundaries over time can also increase uncertainty in stratigraphic drillhole picks, which in turn can lead to less reliable geological models. For instance, in the Galilee Basin, the boundary between Triassic sequences such as the Rewan Group and the upper Permian coal measures can be difficult to pick subsurface from drillhole data (Phillips et al., 2015).
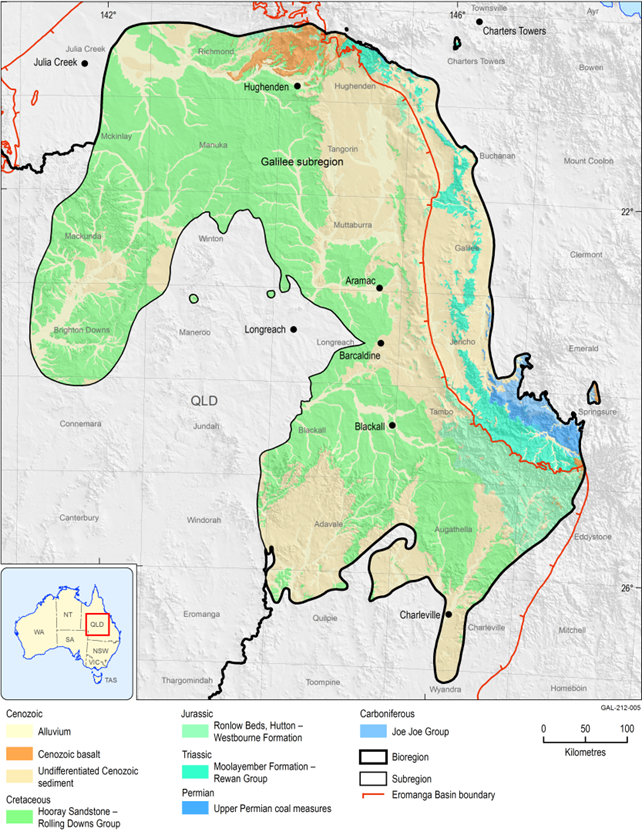
Figure 10 Surface geology and 1:250,000 map sheet coverage in the Galilee subregion
Data: Geoscience Australia (Dataset 11, Dataset 12)
Table 3 References for 1:250,000 geological map sheets in the Galilee subregion
