All geographic data specific to the Galilee subregion were obtained from state or national datasets. This means no statistical analysis or interpolation was performed to generate any of the geographic datasets. However, to characterise errors of the input climate data used for the water balance modelling, some subregion-specific spatial analysis was performed. This is outlined in this section.
In addition to generating daily and monthly grids of meteorological variables (precipitation, maximum temperature, minimum temperature), the Bureau of Meteorology (Jones et al., 2009) also generate daily and monthly root mean square error (RMSE) grids of the same variables. RMSE is often used in comparisons of modelled values with observations; however, the daily and monthly RMSE grids provided by the Bureau of Meteorology are instead a combined measure of the observational error and geostatistical error. The latter is a function of the interpolation algorithm, density of isolated station observations and degree of spatial autocorrelation of the process(es) driving the spatial variance captured in the data being interpolated.
To characterise errors of the input climate data, the long-term (from January 1980 to December 2009) monthly mean values for precipitation (P), maximum temperature (Tmax) and minimum temperature (Tmin) were calculated. Also calculated were the long-term monthly RMSE mean values for the same variables for the same time period. Relative error, expressed as a percent, was calculated by dividing monthly RMSE mean grid by the monthly mean grids (i.e. RMSE grid/mean grid for each meteorological variable).
The spatially-averaged long-term monthly mean P for the Galilee subregion is 39.9 mm/month, and the associated P RMSE subregion mean is 30.7 mm/month (see Figure 3a and Figure 3b respectively). This results in a relative error of 84.7% in the input P grids (Figure 3c). The high relative error is due, in part, to P being a highly spatially variable process (it has low spatial autocorrelation).
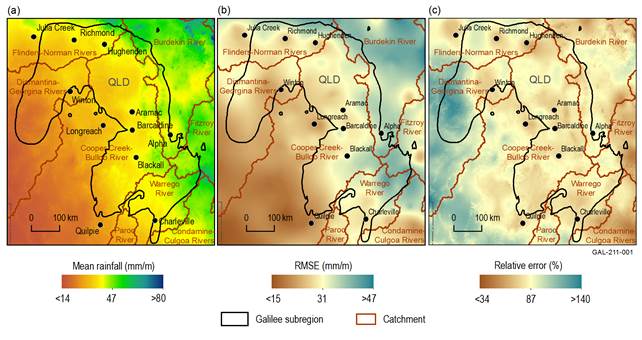
Figure 3 Spatial variation of precipitation from 1980 to 2009
(a) monthly mean precipitation (b) monthly mean root mean square error (RMSE) precipitation and (c) monthly mean precipitation relative error for the Galilee subregion and proximal surface water basins
Population centres are shown by black dots.
Data: Bioregional Assessment Programme (Dataset 1)
For air temperatures, a meteorological field that has higher spatial autocorrelation than P, regional distribution is governed by topography and distance from the ocean. The Tmax spatially-averaged long-term monthly mean is 30.7 °C for the Galilee subregion (Figure 4a). The associated RMSE is approximately 0.3 °C (Figure 4b), which leads to a relative error of approximately 1% for Tmax (Figure 4c). For Tmin in the Galilee subregion, there are similar spatial patterns, with the spatially-averaged long-term monthly mean being 15.9 °C (Figure 5a) and the associated RMSE being approximately 0.5 °C (Figure 5b), which leads to a relative error of about 3% for Tmin (Figure 5c).
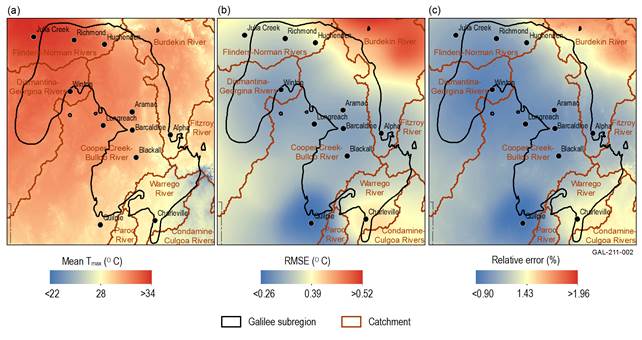
Figure 4 Spatial variation of maximum air temperature (Tmax) from 1980 to 2009
Population centres are shown by black dots.
Data: Bioregional Assessment Programme (Dataset 1)
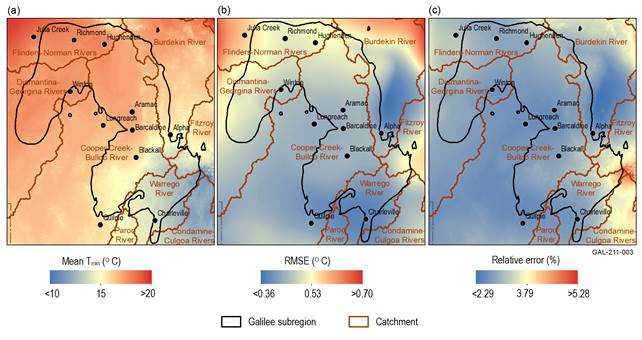
Figure 5 Spatial variation of minimum air temperature (Tmin) from 1980 to 2009
Population centres are shown by black dots.
Data: Bioregional Assessment Programme (Dataset 1)
