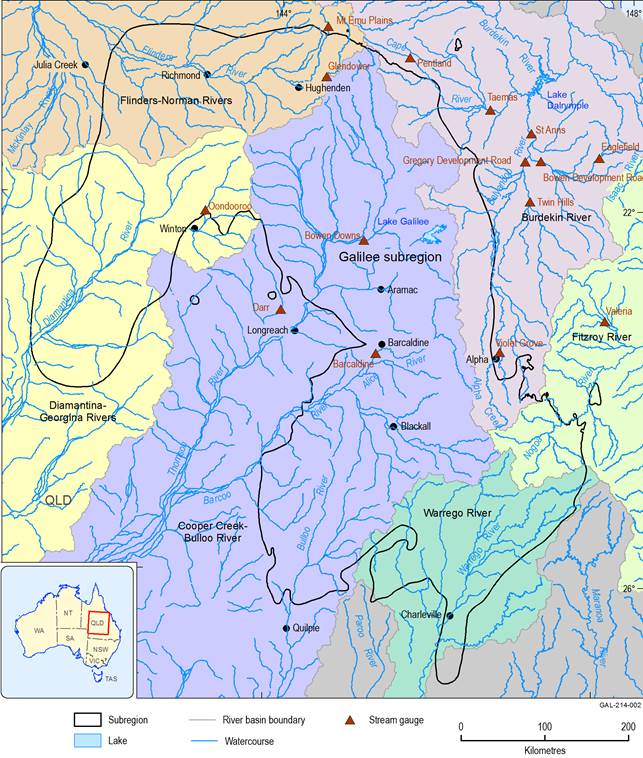
Daily streamflow data for the gauging stations within and adjacent to the Galilee subregion were obtained from the Department of Natural Resources and Mines (DNRM) of the Queensland Government. Out of 36 gauges, data from 15 gauges were used for hydrological model calibration and CRDP impact assessment (Figure 87). Location, catchment area and data period of the gauging stations are presented in Table 23. The first four (002105, 003204, 003205 and 003302) and last two (915011 and 915013) gauges in Table 23 are located within the Galilee subregion and the rest are in the Burdekin river basin where most of the proposed mining sites are located except one in the Fitzroy river basin (130210). Eight headwater gauges (002105, 003204, 003205, 003302, 120307, 130210, 915011 and 915013) were used for model calibration. Only gauges that have long-term measurements (>20 years from 1980), are currently not impacted by coal mining or coal seam gas or other major extractive industries, have no significant flow regulation (e.g. dams), are not nested, and are located within or close to the Galilee subregion, were selected for model calibration. Eight gauges (120301, 120302, 120303, 120304, 120305, 120307, 120309 and 120310), that were located within the surface water impact modelling domain, were used for model validation. The gauge 120307 (Pentland on Cape River) is common in both model calibration and validation. The majority of these gauges have about 40 years of observed data and the data show strong seasonal and inter-annual variability in streamflow (Figures 44 to 49 in companion product 1.1 for the Galilee subregion (Evans et al., 2014)).
Data: Bureau of Meteorology (Dataset 1)
Table 23 Gauge information for streamflow data for the Galilee subregion
Data: Queensland Department of Natural Resources and Mines (Dataset 2)
Streamflow records for all gauges listed in Table 23 were checked against the quality code used by the Queensland Government. The data were processed into unified six-class quality codes for each gauge (Zhang et al., 2013). The six unified quality categories against their quality codes are given in Table 24. The quality categories are defined as follows:
- good: data are an accurate representation of streamflow
- fair: data are a moderately accurate representation of streamflow
- poor: data are a poor representation of streamflow and may be unsuitable for some quantitative applications
- unverified: data quality is not known
- non-conforming: data are unsuitable for most applications requiring quantitative analysis, but may contain useful qualitative information
- missing: data are missing or unusable.
The streamflow data flagged as good, fair, poor and unverified were kept while the flow data flagged as non-conforming were excluded. The non-conforming and missing streamflow data are both labelled in the data set as –9999.
Table 24 Quality codes for the Queensland gauging stations for the Galilee subregion
|
Numerical codes |
Description |
|---|---|
|
1–18, 16 |
Good |
|
20 |
Fair |
|
30–69, 160 |
Poor |
|
130–150 |
Unverified |
|
79, 119, 160–200 |
Non-conforming |
|
19, 151, 255 |
Missing |
Data: Queensland Department of Natural Resources and Mines (Dataset 2)
Table 25 summarises the percentage of data under each quality code for the selected gauges. Most of the data fall into the good, fair and poor categories. Five gauges have more than 10% non-conforming data. The amount of missing data is relatively low (~2%) except for gauge 120304 (Suttor River at Eaglefield).
Table 25 Percentage of streamflow data under different quality categories in the Galilee subregion
Data: Queensland Department of Natural Resources and Mines (Dataset 2)
