2.1.2.2.1 Bore locations
The location of a bore and the height of a bore above a datum (usually the Australian Height Datum (AHD)) are crucial information for geological and hydrogeological modelling and interpretation. The accuracy of the bore location coordinates will vary depending on methods used to determine its location and the original purpose for the bore. Although not always the case, resource company drill data are usually more accurately located than groundwater bore data. Due to the expense of drilling and construction, the location of deep groundwater bores is usually better defined than the location of shallow groundwater bores. Bore location accuracy was not assessed as part of the BA.
Most groundwater bores in the Galilee subregion did not have elevation recorded in the database. Elevation data were calculated using the Geoscience Australia, 1-second Shuttle Radar Topography Mission (SRTM) digital elevation model (DEM) (Geoscience Australia, Dataset 19). The locations of most CSG and petroleum wells are formally surveyed, thus elevation data were available from well completion reports. Surveyed bore elevation data were utilised as part of the geological modelling process.
2.1.2.2.2 Stratigraphic data from drillholes
Useful stratigraphic information from borehole data includes downhole depths to the top of a stratigraphic interval and thickness of a stratigraphic interval in a bore. To estimate an interval thickness both depths to the top and base of the stratigraphic interval are required. Not all stratigraphic intervals are fully intersected, for instance a bore may be drilled until a target stratigraphic interval is reached.
Of the 7350 bores identified in Section 2.1.2.1.2, some 3301 bores (45%) have a stratigraphic record (Table 4). Of these, stratigraphic records from 2366 bores have data of suitable quality that could be potentially utilised for modelling.
Table 4 demonstrates that the majority of groundwater bores in the Galilee subregion are missing what is considered to be interpretable stratigraphic picks. Many stratigraphic picks from groundwater bores are of limited use due to the records missing from either one or both downhole depth intervals or alternatively the stratigraphic description is difficult to interpret. This is a reflection of the archival nature of the bore databases, as outlined in Section 2.1.2.1.5.1.
Petroleum, CSG and stratigraphic bores with missing stratigraphic picks are either old bores (pre-1970s) or recently drilled wells with data that are still classed as confidential.
Table 5 shows there is considerable variation in depths to top of various major stratigraphic units and thickness encountered by drillholes for major stratigraphic groups in the Galilee subregion. In general, the mean thickness approximates the 50th percentile for stratigraphic formations in the Eromanga Basin (Winton Formation down to the Ronlow beds). The exception is the Ronlow beds, which could be due to the small number of samples available. There is considerably more variation between median percentile and mean thickness for stratigraphic units assigned to the Galilee Basin (Moolayember Formation down to the Joe Joe Group). The difference between the 90th percentile of thickness and the maximum thickness demonstrates that the latter usually represents an extreme value. Extreme values may reflect poor stratigraphic picks (especially in the case of surficial sediments) or natural variation of units intercepted by sparse deeper drilling data. The lower units of the Galilee Basin sequence are known to infill extreme topography and the resultant high variability could readily account for such statistics. Table 5 also provides a summary of drillhole data available for various geological formations.
Table 4 Number of bores and stratigraphic record data from bore databases for the Galilee subregion
apercentage of total number of bores in Galilee subregion
CSG = coal seam gas
Data: Bioregional Assessment Programme (Dataset 8)
Table 5 Statistics on bore intercepts for stratigraphic units in the Galilee subregion
Basement represents the base of the Galilee subregion, thus statistics on thickness and number of bores that fully intercept a unit cannot be computed.
na = not applicable
Data: Bioregional Assessment Programme (Dataset 8)
2.1.2.2.3 Structure
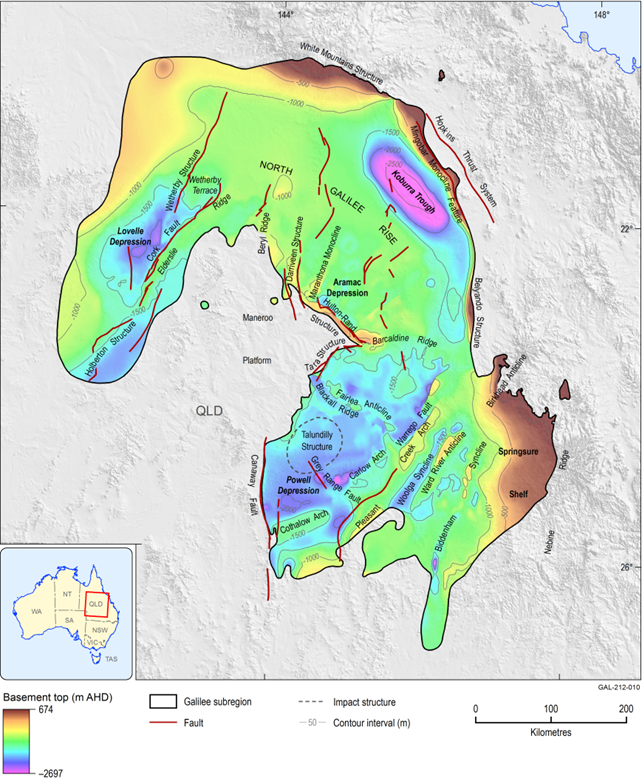
Regional-scale structures identified from historical geological mapping (Table 3), drill data and geophysical surveys are shown in Figure 11. Geological subsurface mapping (Section 2.1.2.2.5; Moya et al., 2015), suggests that disruption and modification of Galilee subregion sequences can occur across some of the large-scale faults and folds. More local-scale faults are apparent on some of the maps presented in Section 2.1.2.2.5.3 (e.g. Figure 22, Figure 27).
Aside from regional structures on published maps, finer-scaled structuring is also evident in the geophysics (Figure 8). Some of these structures are the focus of ongoing research (e.g. the Thomson Orogen and Cork Fault; see Spampinato et al., 2015a, 2015b, 2015c for further detail). A proportion of finer-scale features evident in Figure 8 may only affect geological basement rocks, which underlie Galilee Basin sedimentary rocks. The effect these have on overlying Galilee and Eromanga basins is not always apparent due to the density of drillhole data and the distribution and quality of available seismic line data (Figure 6). However, it is likely that ongoing research will uncover further structures that significantly modify Galilee subregion stratigraphy (e.g. Moya et al., 2015).
Environmental impact statements (EISs) from recent publicly available coal mine development proposals include only limited information on mine-scale geological features such as faults. Some information gleaned from recent reports is as follows:
- Hyde Park: associated with a synclinal fold structure near Galilee Basin margin. Bedding dips 0.5 to 2° west (Saul et al., 2015)
- China Stone: bedding dip varies from north to south ranging from 3 to 6° south-west. A north-north-west trending normal fault, approximately 18 km long with down throws to the east of up to 100 m is present in the northern sections of the mine complex (AGE Consultants Pty Ltd, 2015). This fault offsets the coal seams and has enough displacement to juxtapose Clematis Group sedimentary rocks against Rewan Group sedimentary rocks. The fault runs sub-parallel to nearby regional-scale structures (e.g. Mingobar Monocline) that are situated to the east along the margin of the Galilee subregion (Figure 11)
- Carmichael: four east trending faults with throws in the order of 20 to 40 m were noted in the upper Permian coal measures (GHD, 2013). These faults would have a similar trend to some lineaments present in aeromagnetics data, in the vicinity of the Carmichael development. Bedding dip ranges from 2 to 6° west
- Kevin’s Corner and Alpha coal projects: some small-scale faulting was identified in drill core and minor south-west trending faults have been identified outside the mine development area. However, there is little evidence to indicate the presence of larger-scale folds or faults or that the groundwater flow regime was been influenced by more regional-scale structures (URS, 2012a, 2012b). Bedding dips 1 to 2° west.
2.1.2.2.3.1 Regional-scale features in the Galilee subregion
The Galilee subregion is of the same outline and extent as the geological Galilee basin. The margins of the present-day Galilee Basin are a consequence of erosion and structural control (Figure 11, Figure 29). Isolated erosional remnants that consist of Galilee Basin sedimentary rocks occur to the east of the present-day Galilee Basin boundary. These demonstrate that the basin once had greater extents (Saul et al., 2015).
The main geological features associated with the Galilee Basin are:
Maneroo Platform
The western extent of the Galilee subregion and the northern Galilee Basin is partly fault-bounded against the Maneroo Platform (Figure 11). This platform region occurs where overlying Eromanga Basin rests directly on geological basement. The Maneroo Platform was essentially a north–south basement high throughout most deposition of the Galilee Basin, making the basin essentially U‑shaped in configuration. Both north-eastern and south-eastern sides of the Maneroo Platform are partly fault bounded. The Hulton-Rand Structure effectively acted as a margin to the basin throughout much of the Permian. The Hulton-Rand and Tara structures were intermittently active through the Mesozoic and Cenozoic (Norvick, 1981). The structural fabric within the platform area is north-trending (Figure 6) north of the Hulton-Rand Structure; the north-eastern margin of the platform comprises a series of north-trending half-grabens where the faults have been reactivated at various times during development of the basin (Figure 11, Figure 32)
Canaway Ridge
The Canaway Ridge (Figure 11) is a basement high bounded by the Canaway Fault on its eastern side. It is the boundary between the Cooper and Galilee basins. For a short period during the Late Permian, sedimentation was continuous across this barrier. There was no fault activity during deposition of the Eromanga sequence during the Jurassic to Early Cretaceous, but the ridge was reactivated in the Late Cretaceous to Paleogene with displacement up to 400 m (Ransley et al., 2012).
Nebine Ridge
The Nebine Ridge (Figure 11) is a south-south-west plunging basement high extending south from the exposed Anakie Inlier. This ridge is the demarcation between the south-eastern Galilee Basin and the Bowen Basin to the east, as well as the demarcation between the overlying Eromanga Basin and the Surat Basin to the south-east.
Barcaldine Ridge
The Barcaldine Ridge forms the boundary between the northern and southern sections of the Galilee Basin. In the Galilee Basin sequence (Figure 32b) this feature is manifested as a drape fold over a basement ridge (Casey, 1970). The ridge extends from the eastern corner of the Maneroo Platform near the town of Barcaldine (in companion product 1.1 for the Galilee subregion (Evans et al., 2014)) and descends eastwards towards the southern limit of the Koburra Trough (Figure 11). The relative influence and prominence of this feature varied considerably during deposition of the Galilee Basin sequences and overlying Eromanga Basin. Spurs off this feature that run into the southern Galilee Basin were uplifted and eroded in the Triassic.
2.1.2.2.3.2 Northern section of the Galilee Basin
Koburra Trough
Also known as the Aberfoyle Syncline, this elongate depocentre (Figure 11) aligns with the eastern margin of the northern Galilee Basin, trending northwards from near the Barcaldine Ridge, then north-north-westwards towards, but short of, Hughenden. The Koburra Trough is 300 km long on its north-west axis and 100 km across (Allen, 1974). The north-eastern margin of the trough is structurally defined as a fold or monocline above eastward-dipping thrust faults (White Mountains Structure, Mingobar Structure).
North Galilee Rise
A broad gentle rise in basement extends from the eastern end of the Barcaldine Ridge north-westwards to the Wetherby Terrace and is informally named the ‘North Galilee Rise’. This feature creates a subtle divide between the Koburra Trough and the Aramac Depression and other features found along the western margin adjacent to the Maneroo Platform (Figure 8, Figure 11).
Aramac Depression
The Aramac Depression is a relatively subdued equant-shaped feature (Figure 11) with a depocentre close to the Hulton-Rand Structure near the margin of the Maneroo Platform. The depression is contained to the north by the Maranthona Monocline, and to the south by the Barcaldine Ridge. Eastwards it shallows slightly onto the North Galilee Rise in basement which then descends as the western flank of the Koburra Trough.
Lovelle Depression
Found to the north and west of the Maneroo Platform (Figure 11), this depocentre lies predominantly on the north-western side of a deep narrow basement ridge, the Cork Block-Elderslie Ridge. Towards the south-western extent of the Lovelle Depression, the Galilee sequence descends south-eastwards from this prominent structure. This region remains poorly understood because of an absence of seismic and drillhole data.
Cork Fault and Holberton Structure
The Cork Fault and its south-western continuation the Holberton Structure comprise a major tectonic feature within the Australian continent as part of the Tasman Line demarcating the North Australian Craton from the Thomson Orogen. The Cork Fault is part of a pervasive fault complex within the Lovelle Depression, and is the southern-eastern faulted margin of the narrow Cork Block. At its south-western extent in the Lovelle Depression, the Permian sequence over this fault is downthrown to the north-west in the same sense and magnitude as the paralleling Holberton Structure (Harrison and Bauer, 1976). The Cork Fault was active as a strike-slip fault system in the Neoproterozoic, and was repeatedly reactivated in the Paleozoic (Spampinato et al., 2015b). In the early Permian, the fault was active during subsidence in the Lovelle Depression, and experienced reactivation in the Cenozoic with an overall 420 m of displacement (Ransley et al., 2012). This margin of the Galilee Basin is poorly constrained due to insufficient well data and limited seismic control.
Elderslie Ridge and Cork Block
The south-west-oriented Cork Block in the Lovelle Depression is a narrow ridge (Figure 11) that has faulted margins defined by the Holberton Structure and the Cork Fault. The ridge is continuous north-eastwards into the Elderslie Ridge where the Wetherby Structure is a north-north-eastward trending bifurcation of the fault on the north-western margin of this ridge. To the south-west, the displacement sense changes on these faults, and the Cork Block transitions to a terrace.
Wetherby Terrace
The wedge-shaped Wetherby Terrace lies between the bifurcation of the Wetherby Structure and the Elderslie Ridge and has a gentle plunge to the south (Figure 8, Figure 11).
Hulton-Rand Structure
The Hulton-Rand Structure is located along the south-eastern margin of the Maneroo Platform. At depth it is a fault that demarcates part of the western margin of the Galilee Basin. It transitions from a fault at depth to a monoclinal fold structure at surface (Figure 11, Figure 30). This structure acted as a barrier to sedimentation during the late Paleozoic and Mesozoic eras.
Beryl Ridge, Darriveen Fault and Maranthona Monocline
Along the north-eastern margin of the Maneroo Platform, north-west of the Aramac Trough, are a series of north-trending half-grabens formed in basement (Figure 11). The Beryl Ridge is a northward-plunging drape fold (Casey, 1970) over a basement ridge that extends northwards off the Maneroo Platform. The Darriveen Fault demarcates the margin of another half-graben. The Maranthona Monocline is another drape fold over a half-graben in basement, and lies between the Darriveen Fault to the north and the Hulton-Rand Structure to the south.
Mingobar Structure, White Mountains Structure and Belyando Structure
The White Mountains Structure (Figure 11) is a distinct structural discontinuity on the north-eastern margin of the Galilee Basin and demarcates an abrupt contact of Galilee Basin rocks with underlying basement. The White Mountains Structure, although of different structural expression to the Mingobar Structure, is continuous along strike from where the Mingobar Structure and the Hopkins Thrust appear to converge. The Mingobar Structure is a linear topographic high situated on the margin of the Galilee Basin. It is associated with a west-dipping monoclinal fold and, at depth, thrust faults (Pinchin, 1978). The Belyando Structure was defined as an intense gravity depression on the eastern margin of the Galilee Basin and is co-linear with the Mingobar Structure (Vine, 1965). The more recently defined Belyando Basin (Draper, 2013) occurs in the same area, and there may be some association with the earlier defined Belyando Structure.
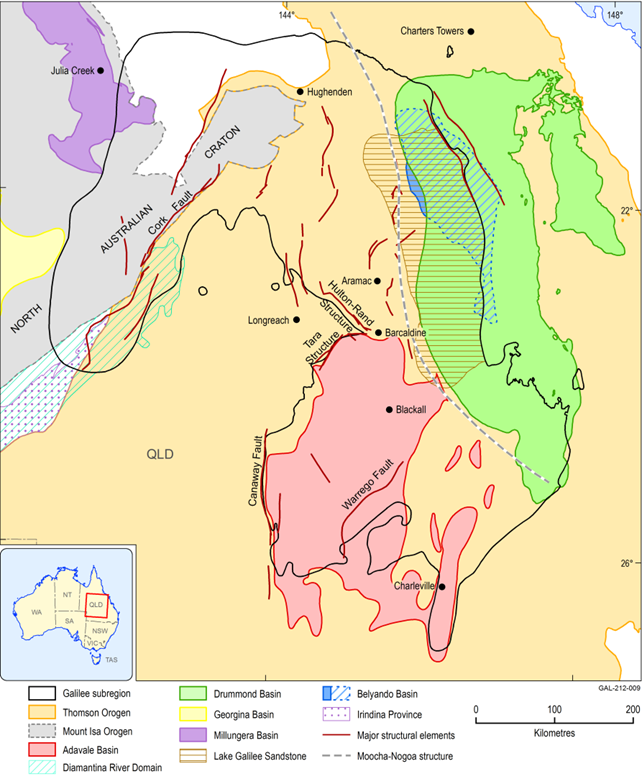
Moocha-Nogoa Structure
It is possible that a new semi-regional structure, here informally called the Moocha-Nogoa Structure (Figure 12 for location), has been identified as part of the BA for the Galilee subregion. This feature passes through Moocha Creek to the north and the Nogoa Scarplands to the south. Further detail on Nogoa Scarplands can be found in Section 1.1.2.1.1 of companion product 1.1 (Evans et al., 2014)). At surface the Moocha-Nogoa Structure approximates the western margin of a series of ranges that occur where sedimentary rocks of Jurassic age outcrop along the eastern margin of the Eromanga Basin. The structure is expressed at surface as a relict Cenozoic duricrusted surface that bears a gentle westward regional tilt. In its regional arcuate course, the Moocha-Nogoa Structure appears to have similar trends to structures identified along the eastern margin of the Galilee subregion (e.g. Mingobar Structure, White Mountains Structure).
Unsurprisingly, at depth, the Moocha-Nogoa Structure also coincides with the inferred western margins of the underlying Drummond and Belyando basins (Figure 12). The Moocha-Nogoa Structure is interpreted to represent the surface expression of an inferred thrust fault that occurs at depth, and its apparent topographic effect implies reactivation in the Cenozoic with uplift associated with the formation of the Great Dividing Range and erosion of the overlying Eromanga sequence.
2.1.2.2.3.3 Southern section of the Galilee Basin
The southern Galilee Basin is complicated structurally due to structure inherited from the Adavale Basin, which almost entirely underlies the Powell Depression.
Powell Depression
This depression flanks the south-eastern side of the Maneroo Platform, and a thin Galilee sequence deepens south-westwards in a stepped manner from the Barcaldine Ridge, over the Fairlea Anticline/Blackall Ridge and the Grey Range Fault towards the Canaway Ridge (Figure 11). Between the Fairlea Anticline and the Grey Range Fault, the circular Talundilly Structure of some 95 km diameter, contains a brecciated, faulted and disturbed sequence in the Jurassic and Cretaceous sequence of the Eromanga Basin, and presumably in basement rocks. Its origin has been ascribed to a bolide impact at about 125 Ma, during Cadna-owie Formation deposition (Longley, 1989).
Pleasant Creek Arch
The Pleasant Creek Arch is a major north-east-trending structure in the underlying Adavale Basin, and flanks the south-eastern side of the Powell Depression (Figure 11). Aligned above the arch is the Warrego Fault. Paralleling these features to the north-west are the Cothalow and Carlow arches. Collectively these arches and the Warrego Fault mark a change south-eastwards in structural style to half-grabens that are aligned north-north-east in the underlying Adavale Basin. In the overlying thin Galilee sequence and thicker Eromanga sequence, this structure has expression as gentle folding in the Noella, Woolga and Biddenham synclines, and Ward River Anticline, which is mapped to the north-east as the Birkhead Anticline.
Data: Bioregional Assessment Programme (Dataset 13)
Tara Structure
The Tara Structure is located along the south-eastern margin of the Maneroo Platform (Figure 11) that is similar in nature to the Hulton-Rand Structure. At depth it is a fault that grades upward to a monocline at the surface (Casey, 1970). The Tara Structure acted as a barrier to sedimentation during the Late Paleozoic and Triassic eras.
Springsure Shelf
The Springsure Shelf is located north-west of the Nebine Ridge and is a transitional zone in the southern Galilee Basin with the Denison Trough of the Bowen Basin to the east.
2.1.2.2.3.4 Geological basement features for the Galilee subregion
Geological basement includes any rocks that are older than the Late Carboniferous–Middle Triassic Galilee Basin. Geological basement includes any older sedimentary basins, as well rocks assigned to the Thomson Orogen and Mount Isa Inlier. The boundary between Thomson Orogen and Mount Isa Inlier (a part of the North Australia Craton) is demarcated by Cork Fault and Diamantina River Domain (Figure 12).
In the eastern part of the subregion, the Thomson Orogen is partly covered by the Adavale and Belyando basins (Devonian in age) and the Late Devonian–Early Carboniferous Drummond Basin. The age of the Millungera Basin is relatively unknown, but it has to be younger than the North Australia Craton as it overlies it, but older than the Galilee Basin. Collectively, all these geological elements form the geological basement to the Galilee and Eromanga basins. Further information on geological elements that underlie the Galilee Basin is outlined in companion product 1.1 for the Galilee subregion (Evans et al., 2014).
Understanding the potential for hydraulic connectivity between Galilee Basin strata and underlying basement rocks is speculative as the hydrological properties of geological basement are poorly known. However, it is probable that fracture permeability would be the only effective permeability in rocks assigned to the Thomson Orogen, Mount Isa Orogen and the Diamantina River Domain (Figure 12). Fractures are more likely to occur near faults. How permeable a fault or a fracture is at depth is dependent on several factors including: the amount of fault offset, type of fracture infill, and the orientation of a fracture relative to the present-day stress field.
Other potential areas of enhanced structural connectivity may occur where fault bound blocks of basement rocks are fractured, uplifted and juxtaposed against Galilee Basin or Eromanga Basin sedimentary rocks. In the Galilee subregion these areas principally occur along major faults located around the margin of the Maneroo Platform, the Barcaldine Ridge, the Lovelle and Powell depressions and the Warrego Fault.
Another area of potential connectivity between Galilee Basin sediments and underlying basement may be where the Lake Galilee Sandstone overlies older sedimentary basins such as the Drummond Basin. There may also be some structural control on the distribution of Lake Galilee Sandstone as its western margin approximates the edge of the Drummond Basin, the Belyando Basin and the Moocha-Nogoa Structure (Figure 12).
Data: Geoscience Australia (Dataset 14), Bioregional Assessment Programme (Dataset 15)
2.1.2.2.4 Galilee subregion geological model
This model was developed to be the basis of groundwater modelling and also as a way to present and understand regional geology for the Galilee subregion. The Galilee subregion geological model was developed as a composite of stratigraphic surfaces that were derived from two different approaches. Surfaces for the Galilee Basin sequence were generated in a basement-upwards approach. Surfaces for the overlying Eromanga Basin sequence and uppermost Cenozoic cover were largely adopted from the GAB Atlas (Ransley et al., 2015) and surface elevations were generated from the ground surface downwards.
These contrasting approaches were necessitated by the severely limited borehole data available for the Galilee Basin sequence. To enable extension of this data, existing seismic interpretations were combined with the Phanerozoic basement model OZ SEEBASE (de Vries et al., 2006). This OZ SEEBASE basement surface was itself developed around control offered by very limited borehole data, and extended regionally with the integration of both seismic data available as of 2006, and basement depth estimates modelled from potential field data (gravity and total magnetic intensity).
2.1.2.2.4.1 Galilee Basin geological surfaces
The Galilee Basin geological surfaces as described in Section 2.1.2.2.5.3 were generated at a semi-regional scale. While the accuracy of each geological surface will vary depending on the density and quality of various datasets, overall the reliable resolution is probably in the order of 1:500,000.
Datasets
The Galilee Basin geological model was built entirely from public domain datasets – namely drilling records from petroleum wells and groundwater bores, regional geological mapping, 1-second DEM, regional seismic reflection surveys and OZ SEEBASE.
A brief description of each dataset follows.
- bores and wells. (Queensland Department of Natural Resources and Mines, Dataset 16; Geological Survey of Queensland, Dataset 17). All groundwater bores (Queensland Department of Natural Resources and Mines, Dataset 16) and petroleum wells (Geological Survey of Queensland, Dataset 17) within 25 km of the Galilee Basin subregion were included in the project. Well and bore data were used to define the top and bottom of each formation as well as its extent. Stratigraphy was determined from well completion reports (WCR) and drillers’ logs. Where naming conflicts existed, a standard nomenclature was developed for the Galilee Basin. Additionally, where generic names were used in the WCR, such as ‘undifferentiated Permian’, drilling logs and geophysical logs were used to discern the target formations. Depth to formation was converted to metres above the Australian Height Datum (m AHD) by subtracting the height of the drilling rig datum as shown in the well completion report (WCR) by the depth to formation. Where drilling rig datum was not available, height was obtained from the 1-second DEM plus 2 m to represent height of the drilling rig datum. Once a complete dataset of wells and bores was available for each formation, additional quality assurance and quality control was performed on the data to find anomalous wells and bores (i.e. wells and bores with improbable depth to formation). The cause of an anomaly was commonly due to not converting feet to metres or a misidentification of a geologic unit. If the anomaly could not be resolved, then the well or bore was removed from the dataset.
- published geological maps (Queensland Department of Natural Resources and Mines, Dataset 18). Outcropping areas of the target formations were chosen from geographical information system (GIS) coverage of Queensland geology and were used to create outcrop maps for each formation. The subsurface well data were used to define the extent of each formation. Subsurface intercepts of the top of each unit were corrected for DEM or kelly bush height to generate the top surface of the formation relative to Australian Height Datum (AHD). The kelly bush is the part of the petroleum drilling rig that connects the drill rods to the rotary table, which in turn rotates the drilling rods during drilling. Drilling depth measurements from petroleum rigs commonly reference the kelly bush rather than ground level.
- DEM (Geoscience Australia, Dataset 19). A 1-second DEM was used to determine the ground elevation for wells and bores and also as a proxy for the formation tops where it was outcropping. This dataset offers the highest resolution of topography currently available to cover the entire Galilee subregion.
- seismic surfaces (Queensland Department of Natural Resources and Mines, Dataset 20). Two prominent seismic surfaces, bottom of the Galilee Basin and top of the upper Permian coal measures, were chosen from Y80A, W81A, Carmichael, Pendine, T81A, Quilpie, Ward and Powell Creek seismic reflection surveys. Maps from the surveys were georectified and then depth and structures were digitised. The original gridded data for seismic horizon mapping was not available, therefore a velocity model derived from petroleum well check shot surveys could not be built. Depth conversion instead relied on using well and bore depths to convert time contours to depth contours.
- OZ SEEBASE (FROGTECH Pty Ltd, Dataset 21). The depth to magnetic basement model, OZ SEEBASE (de Vries et al., 2006), was used as an interpretive template to guide the location and trend of basement structures in areas that were otherwise not covered by available seismic interpretation. However, it must be emphasised that the OZ SEEBASE basement model was limited to pre-2006 data and utilised total magnetic intensity (TMI) data of poorer resolution than available as of 2016. Additionally, this modelled surface represents the magnetic basement. This can be generally assumed to be base Phanerozoic; however, thick Proterozoic basins are known to underlie the north-west of the subregion and magnetic basement would underlie these older basins as well.
2.1.2.2.4.2 Components of the Galilee Basin geological model
The Galilee geological model was initially developed separately, built from the interpreted basement upwards.
In the Galilee Basin sequence, the top of each stratigraphic unit became the base/container for the overlying unit. Because of the depth of the base of the Galilee Basin (up to 3000 m), a bottom-up approach was initially thought to more accurately portray basement structures and their role in determining depositional centres and groundwater flow direction.
Broadly, there are three components for each stratigraphic unit in the geological model: depth to top/bottom of the unit, stratigraphic unit extent and the influence of faults and basement structure.
Depth to top/bottom of stratigraphic unit
While being an essential control, low-density drillhole data are inadequate to represent the spatial complexity of stratigraphic units. In the Galilee Basin geological model, these well intercepts were supplemented by contours derived from interpreted seismic imagery and OZ SEEBASE. The rationale is that the base of the formation (the container) will influence depositional processes and the geometry of the formation above it. Contours from the base of the formation were copied and modified based on well and bore data to represent the top of formation.
Where the component formations of a stratigraphic unit outcropped along the eastern margin of the Galilee Basin, the top of the formation was considered the same as the DEM.
Stratigraphic unit extent
The Galilee geological model tried to represent the complexities of the Galilee Basin geology including erosional holes and variable thickness as influenced by deposition, erosion and structure.
On the eastern margin of the Galilee Basin the extent of the stratigraphic units is the same as the outcrop of component formations, as shown in the surface geology. Elsewhere the stratigraphic unit extent and thickness were determined from well and bore data and seismic interpretation. The surface of the unit is guided by the presence of basement structures as evident in seismic imagery and the OZ SEEBASE surface.
Faults and basement structures
Faults and basement structures are important parts of the Galilee Basin geological model. They were derived from OZ SEEBASE and seismic surfaces. Underlying structures were extrapolated upwards to overlying units if their influence could be identified in the well and bore data.
Building the Galilee Basin geological surfaces
The Galilee Basin geological model was built using the ArcGIS tool ‘Topo to Raster’, which produced a raster surface of the top of each unit with a cell size of approximately 1 km. The metadata has full details of the inputs for each formation.
Generalised input data were wells, bores, unit specific contours, DEM contours for outcrop and faults (as cliffs). The resulting surface was then clipped by the unit extent to produce a model of the top of unit.
Overlying surfaces were then checked against underlying surfaces and iterative changes to input data were made to ensure that model layers do not interpenetrate.
Each formation in the Galilee Basin geological model has a top, bottom and thickness. The exception is the geological basement model as it represents the base of the whole modelled domain.
2.1.2.2.4.3 Combined Eromanga-Galilee three-dimensional geological model
The three-dimensional geological model for the Galilee subregion is the summed combination of the basal Galilee Basin geological model and a model of surfaces for the Cenozoic cover and Eromanga Basin sequence.
This combined model builds the entire sequence from the ground surface downwards as the ground surface is the most accurately known surface available from the 1-second DEM. This contrasts the bottom-up approach initially used for the geological model of the Galilee Basin sequence.
The top-down approach used thickness maps from the GAB Atlas datasets (Ransley et al., 2015). These thicknesses (isopach maps) were built from lithostratigraphic data from extensive datasets of shallower groundwater bores, and deeper stratigraphic and exploration wells.
The poorest-constrained thickness map in this approach to the upper sequence is that of the Cenozoic. While there is adequate estimation of the Paleogene-Neogene component of Cenozoic cover, estimates of the thickness of the uppermost Quaternary alluvium/colluvium are the least reliable. Although error margins in estimation of this uppermost Cenozoic cover will be in the order of tens of metres, this magnitude is relatively minor – an order of magnitude less compared to the error of estimation of the base Galilee Basin where error margins can be in the order of hundreds of metres where seismic and drillhole data are absent. In data poor areas, error in depths to top of geological features such as formation tops is likely to increase with depth.
The difference between the two models in predicting basement to the Galilee Basin, from between the bottom-up approach (Galilee Basin geological model) and top-down approach (combined Cenozoic-Eromanga-Galilee surfaces), is used as a measure of prediction uncertainty in the overall three-dimensional model for the Galilee subregion (Figure 29). This is discussed below.
The Cenozoic-Eromanga Basin geological model is derived from the GAB Atlas (Ransley et al., 2015; Geoscience Australia, Dataset 22, Dataset 23, Dataset 24, Dataset 25, Dataset 26, Dataset 27, Dataset 28, Dataset 29, Dataset 30, Dataset 31) and consists of isopach data of hydrostratigraphic packages that have been converted to their equivalent grouped lithostratigraphic units: the Paleogene- Neogene Cover, Winton-Mackunda aquifer (Winton and Mackunda formations), Rolling Downs Group aquitard (Wallumbilla Formation, Toolebuc Formation, Allaru Mudstone), Cadna-owie – Hooray aquifer and equivalents (Cadna-owie Formation, Hooray Sandstone, Blantyre Sandstone, and part of the Ronlow beds), the Westbourne aquitard (Westbourne Formation), Adori-Springbok aquifer (Adori Formation), Birkhead-Walloon aquitard (Birkhead Formation), Hutton aquifer (Hutton Sandstone), Evergreen-Poolowanna aquitard (Evergreen Formation) and Precipice Sandstone aquifer (Precipice Sandstone and equivalents). The isopach data were converted to raster surfaces of thickness using ArcGIS and the ‘Topo to Raster’ tool and then clipped to geological extent. Stratigraphic sequences of the Cenozoic cover and Eromanga Basin were then combined with stratigraphic sequences of the Galilee Basin.
To produce the top and bottom of each formation, the thickness of each layer was subtracted from the bottom of the layers above it, starting with the surface and working downwards.
Once a raster surface (top and bottom) for each formation of the Eromanga-Galilee three dimensional geological model was completed, the rasters were converted into a triangular irregular network model (TIN) by using the ‘From Raster’ tool in the ArcGIS – 3D Analyst tool set. These were loaded into ArcScene, resulting in the production of Figure 30, Figure 31 and Figure 32.
2.1.2.2.5 Structure contours and thickness maps for stratigraphic units
Maps of the tops of formations (structural contours of the upper surface) and isopachs (formation thickness) are key interpretive elements in the framework for geological and hydrogeological models used in the BA for the Galilee subregion. There are three stratigraphic packages: Cenozoic cover, Eromanga Basin and Galilee Basin (Figure 9). Surfaces of formation tops and isopachs map data for the Cenozoic cover and Eromanga Basin are derived from the GAB Atlas isopach maps (Geoscience Australia, Dataset 22, Dataset 23, Dataset 24, Dataset 25, Dataset 26, Dataset 27, Dataset 28, Dataset 29, Dataset 30, Dataset 31, Dataset 32), which are discussed in detail in Ransley et al. (2015). Formation top structure and extent maps and thickness maps for the Galilee Basin sequence were produced as part of the BA. They are covered in detail in Section 2.1.2.2.5.3.
2.1.2.2.5.1 Cenozoic cover
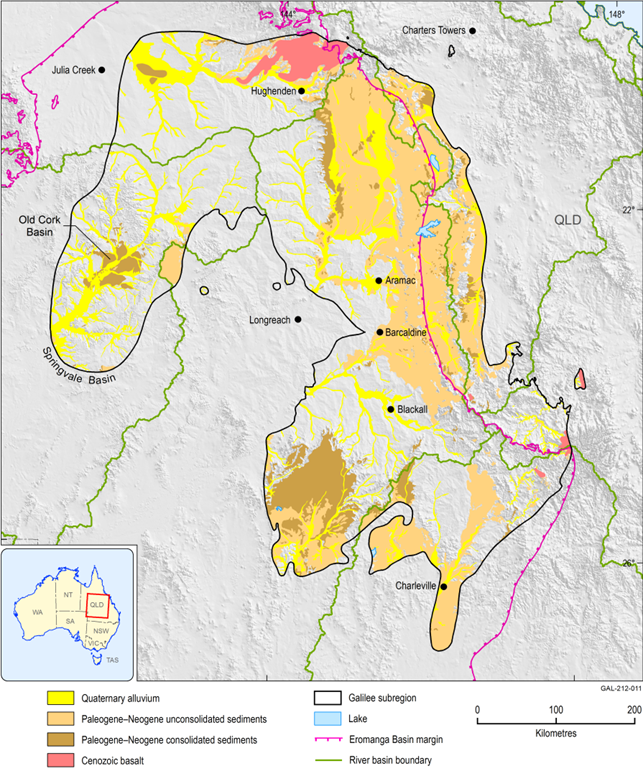
Cenozoic cover (Figure 13) is predominantly found in the eastern and southern parts of the subregion, as well as following major surface drainage systems. Isopach maps and further detail on the Paleogene-Neogene component of Cenozoic cover can be found in Ransley et al. (2015) and Table 3.
Detailed Cenozoic stratigraphy, as outlined in Figure 9, is commonly not differentiated in drillhole data. As a result for the Galilee BA, it is categorised as either: Quaternary alluvium, Cenozoic sediments or basalt. Table 5 indicates the thickness of alluvium and Cenozoic sediments across the subregion as derived from available drillhole data. These data suggest the Cenozoic cover is thickest in areas such as the Warrego River near Charleville, around Alpha and south-west of Blackall over the Powell Depression.
The most advanced coal mining proposals are located in the headwaters of the Belyando River on the eastern side of the Great Dividing Range. This area is largely blanketed by a cover of Cenozoic sediments. Other than groundwater monitoring bores, most drillhole data for this region are not publicly available. Although most company drillhole data are also currently not available, the following information on Cenozoic sediments was gleaned from publicly available reports:
- Hyde Park – upper Permian coal measures are blanketed by Cenozoic sediments (Saul et al., 2015)
- China Stone – where Cenozoic cover is present it varies from 10 to 77 m in thickness, but is typically between 30 to 60 m (AGE Consultants Pty Ltd, 2015). There is a regional thickening from west to east
- Carmichael – Cenozoic cover is almost ubiquitous across the mine area and generally thickens from west to east. From MSEC (2013) it appears that north of the Carmichael River, Cenozoic cover is generally less than 50 m, whereas south of the river it is typically greater than 50 m and up to 80 m in thickness
- China First – Cenozoic sediments almost completely cover the mine area and are generally less than 35 m thick, but can be up to 90 m thick in the eastern region of the mine area (Waratah Coal Pty Ltd, 2013)
- Kevin’s Corner – the entire mine area has Cenozoic cover with thickness varying from less than 5 m in the west to up to around 60 m eastwards with a mean thickness of 40 m (URS, 2012a)
- Alpha – Cenozoic cover has a mean thickness of 40 m, but thins to less than 5 m over topographically high areas found to the west of the mine (URS, 2012b)
- South Galilee – the thickness of Cenozoic cover ranges from 3 to 52 m in thickness with a mean thickness of 21 m (Seedsman Geotechnics Pty Ltd, 2012).
This information suggests that Cenozoic sediments in the Belyando River catchment are generally thicker than that indicated from existing drillhole data presented in Table 5.
Data: Geoscience Australia (Dataset 12), Bioregional Assessment Programme (Dataset 33)
2.1.2.2.5.2 Eromanga Basin
For this product, discussion on the Eromanga Basin sequences (Figure 9) will be relatively brief as Eromanga Basin hydrostratigraphic units thickness maps are derived from data presented in detail in Ransley et al. (2015). Further detail on lithology, depositional environments and other aspects of the Eromanga Basin stratigraphic units can be found in Ransley et al. (2015), companion product 1.1 for the Galilee subregion (Evans et al., 2014) and references outlined in Table 3.
Winton and Mackunda formations
The Winton and Mackunda formations have been grouped into a thick and widespread regional hydrostratigraphic sequence by Ransley and Smerdon (2012), companion product 1.1 for the Galilee subregion (Evans et al., 2014) and Ransley et al. (2015). The same convention was followed for the numerical and geological models for the Galilee subregion.
The Winton and Mackunda formations cover about half of the subregion and this combined unit thickens to the south-west, attaining over 550 m thickness in the Lovelle Depression (Figure 11), and over 650 m at the south-western limit of the Powell Depression. Along the margin of the Maneroo Platform, this combined sequence thickens northward, from less than 120 m against the Hulton-Rand Structure, to over 250 m at the Elderslie Ridge (Figure 14d). The basal Mackunda Formation is generally consistent in thickness at around 100 m. The Winton Formation constitutes the predominantly thicker and overlying continental part of this combined sequence. The lowermost coal interval within this composite sequence is taken as a convenient demarcation between the Winton Formation and underlying Mackunda Formation. The marginal marine Mackunda Formation has the most persistent lateral permeability of the composite Winton-Mackunda sequence.
Much of the Winton Formation experienced intense periods of weathering during the Cenozoic, as evident in exposed kaolinitised and ferruginised sandstone, mudstone and siltstone. Unweathered outcrop appears restricted to well-cemented, medium-to-coarse-grained sandstone that is commonly nodular.
Allaru Mudstone, Toolebuc and Wallumbilla formations
The Allaru Mudstone, Toolebuc Formation and Wallumbilla Formation collectively constitute the Rolling Downs Group aquitard (Figure 14c). These marine units were deposited during a major period of significant sea-level rise and fall in the Cretaceous Eromanga Basin.
The Wallumbilla Formation (Vine et al., 1967) is the most widespread marine unit in the whole of the GAB. Although the Wallumbilla Formation has been subdivided into various members across its extent, they are not readily mappable in the Galilee subregion.
The Wallumbilla Formation was deposited in the Eromanga Basin during a period of rising sea level in the Cretaceous. Its drillhole data (Table 5) indicates it has a mean thickness around 190 m, but can be over 250 m in thickness. The Toolebuc Formation is a distinctive yet thin unit, and is generally less than 30 m in thickness across the subregion. It was deposited at around the time of maximum marine transgression into the Eromanga Basin under anoxic conditions at the seafloor (Ozimic, 1986). The Allaru Mudstone was deposited as the sea receded from the Eromanga Basin. Its drillhole data (Table 5) indicates it has a mean thickness of around 160 m but can be up over 200 m in thickness in places.
These three major units are grouped into a thick and widespread regional sequence known as the ‘Rolling Downs Group Aquitard’ by Ransley and Smerdon (2012), companion product 1.1 for the Galilee subregion (Evans et al., 2014) and Ransley et al. (2015). Across the Galilee subregion, this sequence thickens from its outcrop to locally reaching over 500 m over parts of the Lovelle Depression in the north of the subregion and the Powell Depression in the south (Figure 14). For the Rolling Downs Group aquitard, 90% of intercepts were greater than 77 m in thickness and the overall mean thickness is 292 m (Table 5).
Wyandra Sandstone Member, Cadna-owie Formation and Hooray Sandstone
The Wyandra Sandstone Member, Cadna-owie Formation, Hooray Sandstone, and equivalents have been grouped into a thick and widespread regional hydrostratigraphic sequence (Figure 14b) by Ransley and Smerdon (2012), companion product 1.1 for the Galilee subregion (Evans et al., 2014) and Ransley et al. (2015). In the Galilee subregion portion of the Eromanga Basin, several marginal sandstone facies are differentiated as equivalents and include the Longsight and Blantyre sandstones and part of the section of the Ronlow beds.
According to its drillhole data (Table 5), the Hooray Sandstone averages 60 to 70 m in thickness, the Cadna-owie Formation is around 50 m in thickness, and the Wyandra Sandstone Member is around 18 m in thickness.
The Cadna-owie – Hooray sequence is widespread and its drillhole data (Table 5) indicates it has a mean thickness of 116 m. It extends westwards and northwards from its outcrop areas across the Galilee subregion. Outcrop forms quite a prominent ridge that for the most part is separate from the Great Dividing Range (Figure 13). It is quite thin where it subcrops along the northern margin of Galilee subregion – variably less than 20 m thick. However, it progressively thickens southwards along its outcropping margin to 120 m in thickness at the Nebine Ridge, at the south-eastern limit of the Galilee subregion.
Away from outcrop areas the Cadna-owie – Hooray sequence progressively thickens, reaching up to 260 m in parts of the south-western Lovelle Depression, about 90 m along the north-eastern margin of the Maneroo Platform, and approaching or exceeding 200 m in thickness in the southern Galilee Basin against the Canaway and Nebine ridges (Figure 14b).
The Cadna-owie Formation (Wopfner et al., 1970) is transitional with the underlying Hooray Sandstone. Although relatively thin over the Lovelle Depression and eastern Galilee Basin, this subsurface unit thickens to the south and south-west in the Powell Depression. Some unusual features that formed around the time of the deposition of the Cadna-owie Formation are the Talundilly and Tookoonooka structures. For example, the Tallundilly Structure is some 95 km in diameter, contains impermeable chaotically disturbed strata down sequence from this unit and has been ascribed to a bolide impact (Longley, 1989).
Deposition of the Cadna-owie Formation was in coastal to shallow marine environments and represented the first major marine transgression into the Eromanga Basin sequence, with the Wyandra Sandstone Member possibly being indicative of beach facies (Senior et al., 1975) or a reworked sand sheet from around the upraised Talundilly and Tookoonooka impact features (Gorter et al., 1989).
Injune Creek Group
In the Galilee subregion, the Injune Creek Group comprises the Westbourne Formation, Adori Sandstone, and Birkhead Formation. Drillhole data for the subregion (Table 5) indicates the mean thickness for the Injune Creek Group is 163 m with 90% of intercepts less than 283 m. The uppermost Westbourne Formation, although widespread across the subregion, is thin in subsurface across the northern Galilee Basin where it is less than 30 m in thickness (Figure 14a). Southwards, around the Barcaldine Ridge and into the southern Galilee Basin, the formation thickens regionally to above 80 m and continues to thicken southwards to greater than 120 m around the south-eastern Galilee subregion boundary, the Nebine Ridge (Figure 11).
Underlying the Westbourne Formation is the Adori Sandstone. It unconformably overlies the Birkhead Formation, however, it is conformable with the Westbourne Formation. The Adori Sandstone, although widespread, generally (Figure 15e) only has a mean thickness of 31 m (Table 5). The Adori Sandstone has lateral equivalence to the Springbok Sandstone in the Surat Basin.
The Birkhead Formation has a comparable extent across the subregion as the Hutton Sandstone but is generally not as thick as the Hutton Sandstone (Figure 15d). In the northern Galilee Basin, it is generally less than 50 m thick except for localised increases to 85 m in thickness. In contrast, the formation thickens into the southern Galilee Basin where it is generally greater than 100 m in thickness and thickest south-east of the Warrego Fault (see Figure 11 for location). The Birkhead Formation is laterally continuous eastwards across the Nebine Ridge with the Walloon Coal Measures in the Surat Basin. While the Walloon Coal Measures is the focus of CSG production in the Surat Basin, there is little coal present in the Birkhead Formation in the Galilee subregion.
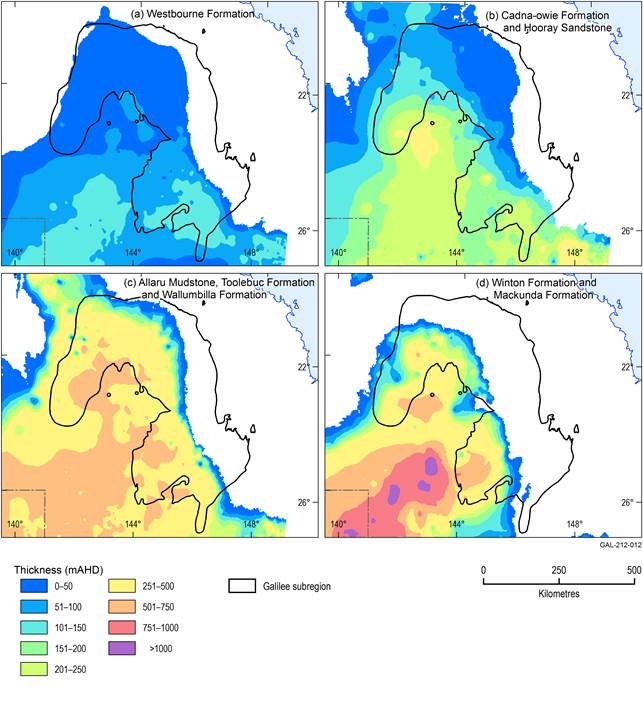
Figure 14 Extent and thickness variations of the Jurassic-Cretaceous sequence of the Eromanga Basin
(a) Westbourne Formation, (b) Cadna-owie Formation and Hooray Sandstone, (c) Allaru Mudstone, Toolebuc Formation and Wallumbilla Formation (Rolling Downs Group aquitard), (d) Winton Formation and Mackunda Formation
Data: Bioregional Assessment Programme (Dataset 13)
Hutton Sandstone and Ronlow beds
The Hutton Sandstone extends in the subsurface over the entire subregion west of its outcrop. North of Jericho, its lateral equivalent in outcrop is the Ronlow beds.
The Ronlow beds is a mapped unit of discontinuous outcrop (Vine et al., 1965) of 30 to 150 m in thickness. It is thought to be a basin margin equivalent of the sequence from Hutton Sandstone up to the Cadna-owie Formation. The incomplete nature of the sequence in the Ronlow beds is probably due to thinning and a depositional hiatus (Cook et al., 2013).
The Hutton Sandstone is widespread in the subregion and although it has an overall mean thickness of around 135 m, it can thicken to over 200 m in the southern Galilee Basin. In the northern Galilee Basin, from the northern flank of the Barcaldine Ridge, the Hutton Sandstone thins both north-westwards and towards and across the Maneroo Platform. There are some locally thick areas up to 150 m on the north-western side of the Koburra Trough (in the areas of the North Galilee Rise) and in the depocentre of the Lovelle Depression (Figure 15c). This suggests that there was some active subsidence at the time of deposition in these areas in the north Galilee Basin.
Evergreen Formation
The Early Jurassic Evergreen Formation has a continuous extent in the southern Galilee Basin where it is variably 30 to 40 m in thickness but has some thicker subsurface pockets south-west of its outcrop (Figure 15b). Along the Springsure Shelf in the southern Galilee Basin, the Boxvale Sandstone Member of this formation is predominant (Exon, 1970) and assumes aquifer characteristics. The Evergreen Formation has a generally comparable extent to the underlying Precipice Sandstone except that it is contiguous with the Poolowanna Formation to the south-west over the Canaway Ridge, outside of the Galilee subregion.
The isolated areas of known basal Jurassic (Precipice) and Evergreen equivalents across the northern Galilee Basin suggest that there was an erosional event in this region and that the Evergreen Formation is disconformably overlain by the Hutton Sandstone (Figure 9). This is consistent with what has been outlined for other parts of the Eromanga Basin (e.g. Ransley et al., 2015). The drillhole data (Table 5) indicate the mean thickness for both units is 77 m.
Precipice Sandstone
The Early Jurassic Precipice Sandstone extent is limited to the southern Galilee Basin where it thickens eastwards in outcrop and subsurface to about 81 m, near the Birkhead Anticline, and maintains that thickness towards the Nebine Ridge. The unit thins south-westwards and wedges out within the subregion in the vicinity of the Canaway Fault (Figure 15a).
Scattered linear occurrences of a basal Jurassic sandstone exist in the northern Galilee Basin (Ransley et al., 2015). Early exploration drilling ascribed these intersections of about 28 to 74 m in thickness to either basal Jurassic Sandstone or basal Jurassic where an upper facies of Evergreen Formation equivalent was sometimes present (Archer and Armstrong, 1986; Bell, 1985). This Precipice Sandstone equivalent occurs as isolated narrow linear belts up to 80 m in thickness against some of the more significant structures such as the Cork Fault and Beryl Ridge.
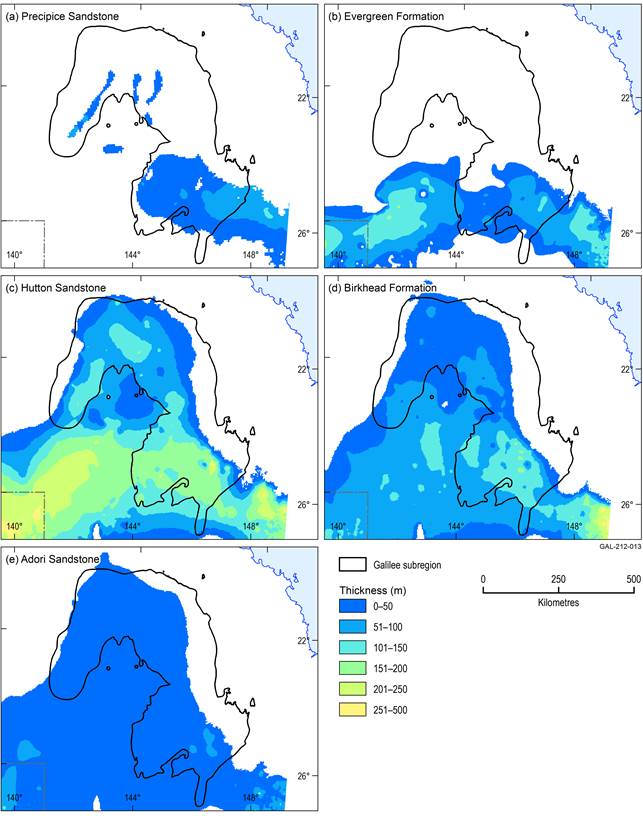
Figure 15 Extent and thickness of the lower stratigraphic sequence of the Eromanga Basin
(a) Precipice Sandstone, (b) Evergreen Formation, (c) Hutton Sandstone, (d) Birkhead Formation, (e) Adori Sandstone
Data: Bioregional Assessment Programme (Dataset 13)
2.1.2.2.5.3 Galilee Basin
Structure contour maps for the upper surface of major stratigraphic units as well as thickness (isopach) maps have been generated for the Galilee Basin as part of the BA for the Galilee subregion. These stratigraphic packages include: Moolayember Formation, Clematis Group, Rewan Group, upper Permian coal measures and Joe Joe Group. A surface of structural contours has also been generated for the top of basement to the Galilee Basin (Figure 11).
Table 6 presents some basic statistics on formation thickness for the modelled layers in the Galilee Basin. Some differences are evident in figures presented for each formation in Table 5 and Table 6. A major reason why that is the case is that data presented in Table 6 are derived from grids interpolated from a number of sources (including geological mapping derived from seismic reflection surveys) as well as some of the drillhole data presented in Table 5.
Table 6 Statistics on thickness of stratigraphic units in the Galilee Basin as calculated from the modelled layers
Data: Bioregional Assessment Programme (Dataset 13)
Further details on methods used to produce the models are outlined in Section 2.1.2.2.4. Only stratigraphic intercepts considered fit for purpose, and consistent with other data, are used to model a particular surface. This is due to the potential issues associated with using archival data as outlined in Section 2.1.2.1.5.1.
Moolayember Formation
The Moolayember Formation has a broad extent across the Galilee Basin (Figure 16, Figure 17). It comprises predominantly mudstone and siltstone, with minor medium- to coarse-grained pebbly lithic sandstone. Outcrop is only found along the eastern margin of the Galilee Basin, particularly along the crest, and just west of the Great Dividing Range.
The Moolayember Formation conformably overlies the Clematis Group and other underlying units such as the Warang Sandstone. The top of the Moolayember Formation is eroded to varying degrees; this erosional surface (unconformity) forms much of the contact with the overlying Eromanga Basin in the Galilee subregion.
Figure 16 demonstrates that the Moolayember Formation has a regional westerly to south-westerly dip, reaching its greatest depth at 1214 m below sea level (BSL) in the Lovelle Trough. It is absent from the Powell Depression, much of Balcaldine Ridge and the western margin of the Galilee Basin.
Overall the Moolayember Formation has a mean thickness of 182 m with 90% of it being less than 364 m (Table 6). The Moolayember Formation is thickest (Figure 17) in the northern Galilee Basin in the Koburra Trough (upwards of 600 m). It also locally thickens up to 405 m adjacent to the Cork Fault in the Lovelle Depression. It thins to the south of the Barcaldine Ridge, along the Springsure Shelf and along its western margin.
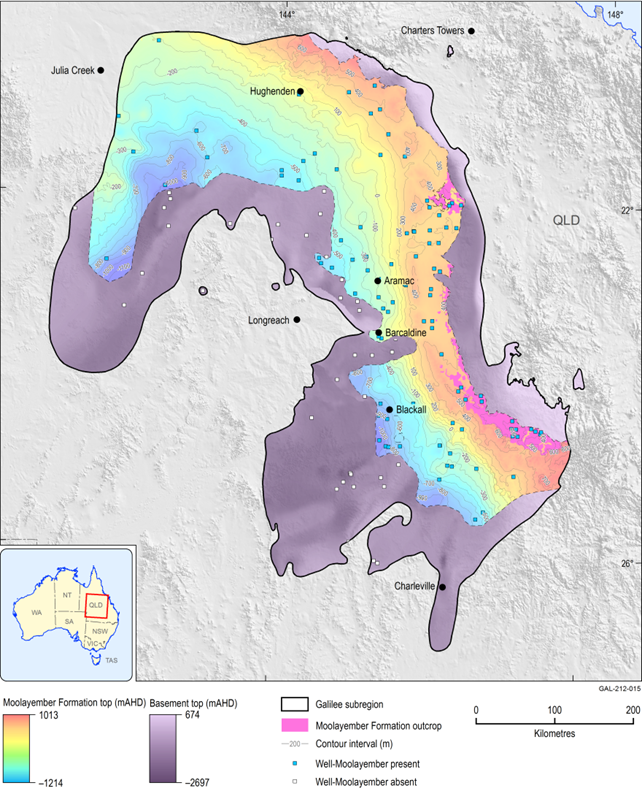
Figure 16 Elevation of the top of the Moolayember Formation in the Galilee Basin
Data: Bioregional Assessment Programme (Dataset 13)
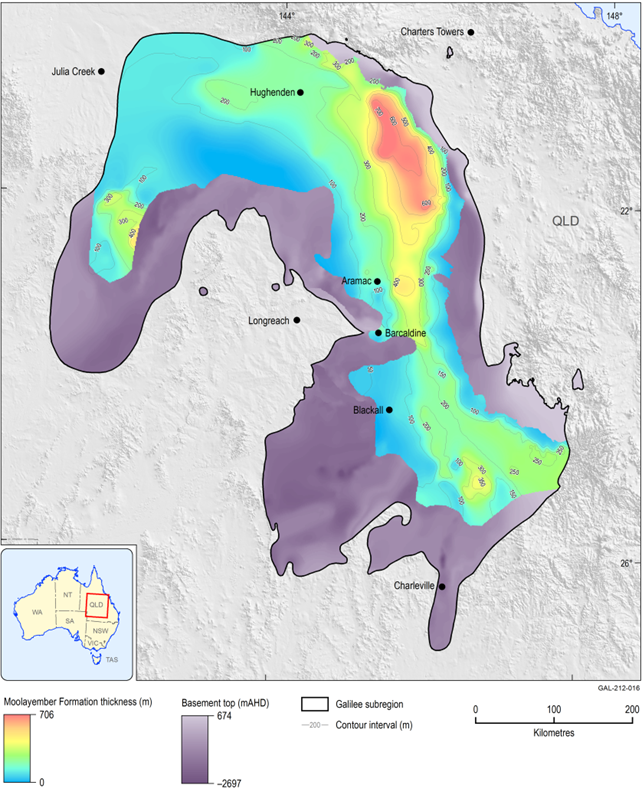
Figure 17 Extent and thickness of the Moolayember Formation in the Galilee Basin
Data: Bioregional Assessment Programme (Dataset 13)
Clematis Group and Warang Sandstone
Due to a relative lack of data, the Warang Sandstone is included as part of the Clematis Group. The Warang Sandstone outcrops along the north-eastern margin of the Galilee Basin and has limited extent south-westwards into the Lovelle Depression.
The Warang Sandstone is in part a lateral equivalent of the Clematis Group (Figure 9). The Clematis Group unconformably overlies the Rewan Group but is conformably overlain by the Moolayember Formation.
The Clematis Sandstone comprises fine- to very coarse-grained quartzose sandstone that are friable and porous with lesser siltstone and mudstone. The Warang Sandstone consists predominantly of poorly sorted kaolinitic sandstone with interbedded siltstone, mudstone and conglomerate (Gray, 1977). Sandstones are medium- to very coarse-grained, generally poorly sorted with calcitic cements. The apparent differences in sedimentology and provenance are likely to cause differences in the hydraulic properties of the Warang Sandstone and Clematis Group. Sandstones of the Clematis Group accumulated under braided fluvial conditions.
Clematis Group and Warang Sandstone outcrop occur along the eastern margins of the Galilee Basin (Figure 18), near the crest of the Great Dividing Range. The contour spacing (Figure 18) suggests there can be relatively considerable variation in the degree of dip. In general these formations dip west to south-west. Unlike what occurs in the overlying Moolayember Formation, the top of the Clematis Group appears to have quite variable dip in the vicinity of the Koburra Trough. The reason for the difference is that the morphology of the top of Moolayember Formation (Figure 16) is largely a result of the significant erosion that occurred after deposition of sediments ceased in the Galilee Basin. Erosion of the Clematis Group (Figure 18) appears to have been more confined to around the margins and thus there is a greater likelihood of preserving features active around the time of deposition.
The Clematis Group has been intercepted down to about 1214 m BSL (Figure 18) in the southern Galilee Basin. It is largely absent from the Lovelle and Powell depressions and along much of the south-western margins of the Galilee Basin. A significant erosional hole is centred along the Barcaldine Ridge.
The Clematis Group has a mean thickness of 117 m with 90% of it being less than 213 m thick (Table 6). It is thick in the Koburra Trough (Figure 19) but is thickest near the northern margin of the Galilee subregion (up to 390 m) near Warang Sandstone outcrop. The Clematis Group generally thins westwards and southwards to less than 100 m. In the southern Galilee Basin, along and south-east of the Pleasant Creek Arch, there is a regional thickening of the unit up to 270 m. Thicker sections (greater than 250 m) align with the trends of regional folds and structure in the area.
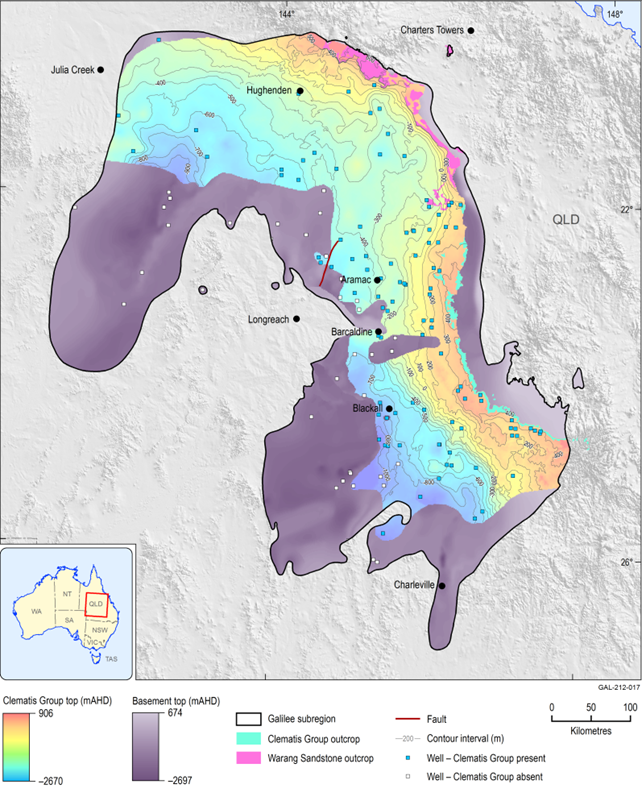
Figure 18 Elevation of the top of the Clematis Group in the Galilee Basin
Top of formation mapping incorporates both top of Warang Sandstone and top of Clematis Group.
Data: Bioregional Assessment Programme (Dataset 13)
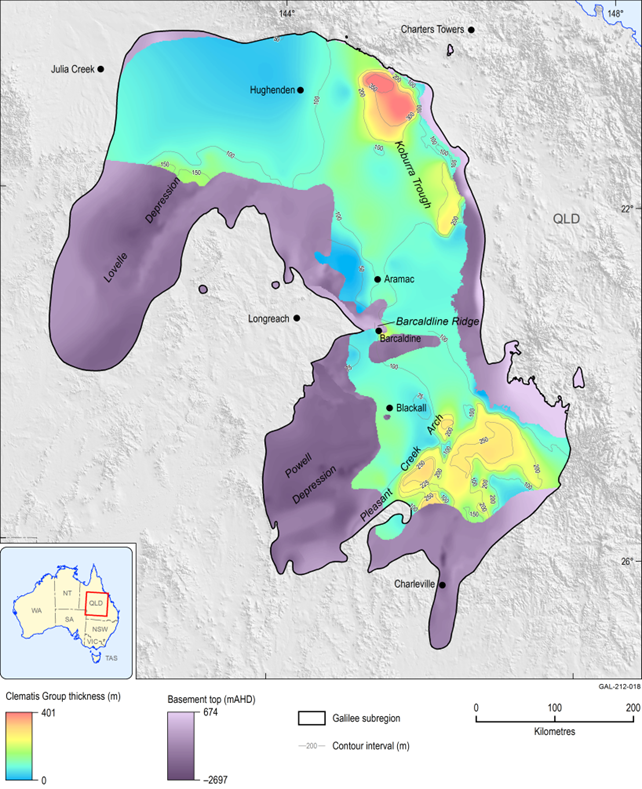
Figure 19 Extent and thickness of the Clematis Group in the Galilee Basin
Thickness map is inclusive of the Warang Sandstone and Clematis Group
Data: Bioregional Assessment Programme (Dataset 13)
Rewan Group
In the Galilee Basin, the Rewan Group includes both the Rewan Formation and the Dunda beds (Figure 9). Although use of the term ‘Rewan Group’ has previously been generally unique to the Bowen Basin, it is used here for the Galilee Basin sequence to be inclusive of the Rewan Formation and Dunda beds as per McKellar and Henderson (2013). The Dunda beds only occur along the eastern margin of the northern Galilee Basin. The Rewan Group unconformably overlies the upper Permian coal measures, and is in turn disconformably to unconformably overlain by the Clematis Group.
The Rewan Formation consists of interbedded sandstone, distinctive grey to green siltstone and mudstone. Fine to coarse-grained sandstones are frequently occluded with calcitic cement. These sedimentary rocks were deposited as continental fluvial red beds with a significant input of volcanolithic sediment under hot climatic conditions. This formation is an excellent aquitard across much of its extent.
The Dunda beds (Vine et al., 1965) extend across the eastern Koburra Trough but are limited southwards. This unit is a sandier facies that is superimposed over and interdigitates with the Rewan Formation. The Dunda beds predominantly consist of sandstone in the lower half, but with a transition to mudstone and siltstone in the upper sequence.
The Rewan Group (Figure 20) outcrops along the eastern margin of Galilee Basin, just east of the crest of the Great Dividing Range and reaches its deepest point at around 1200 m BSL into the Lovelle Depression. It has similar regional dips to those of the overlying Clematis Group. The Rewan Group, is largely absent from the Lovelle Depression and across much of the south-western part of the southern Galilee Basin; however, it does extend along the Springsure Shelf to the Nebine Ridge. Of significance is the erosional absence of this aquitard at the western end, and it is very thin across the eastern end of the Barcaldine Ridge (Figure 19, Figure 20), which enables upper Permian coal measures to be in direct contact with the overlying Eromanga Basin sequence and specifically the Hutton Sandstone. The Rewan Group is also missing along the north-north-eastern margin of the Galilee Basin which would allow the Warang Sandstone to be in direct contact with the upper Permian coal measures. This may have implications for connectivity between the two units in these areas.
The Rewan Group has an overall mean thickness of around 148 m with 90% of it being less than 297 m in thickness (Table 6). The Rewan Group extends across the entire Koburra Trough where it reaches a maximum thickness of over 400 m centrally, but thins and wedges out westwards towards the Maneroo Platform (Figure 21). The Rewan Group thins south-eastwards across the north-eastern part of the Springsure Shelf, and is absent south-westwards beyond the Fairlea Anticline in the Powell Depression.
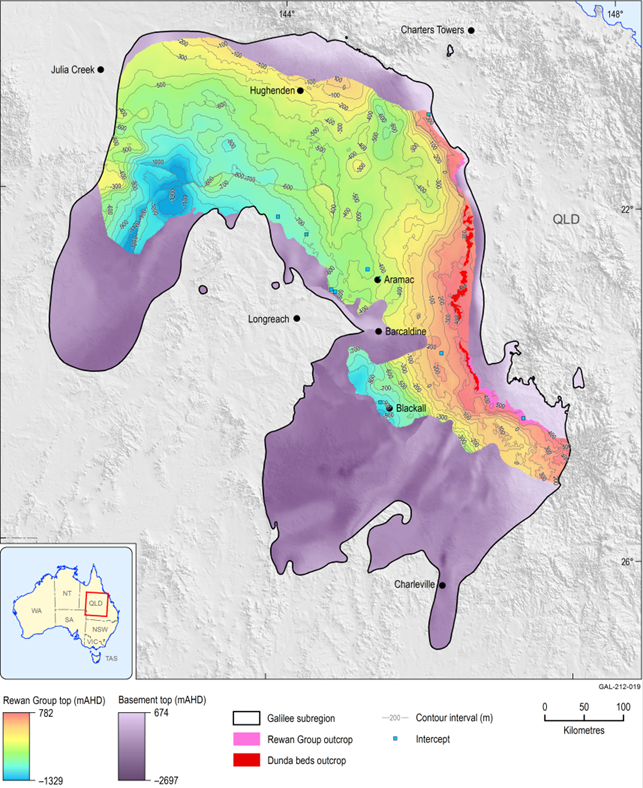
Figure 20 Elevation of the top of the Rewan Group in the Galilee Basin
Data: Bioregional Assessment Programme (Dataset 13)
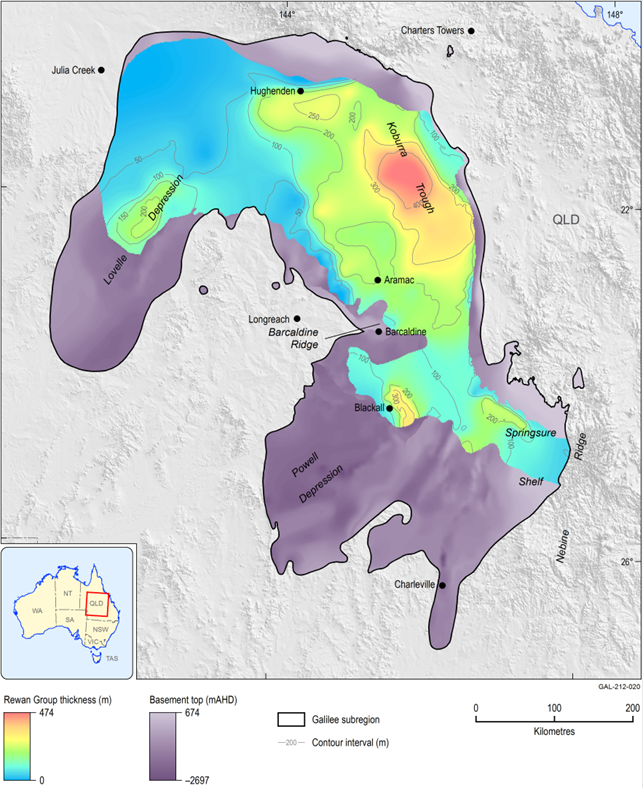
Figure 21 Extent and thickness of the Rewan Group in the Galilee Basin
Data: Bioregional Assessment Programme (Dataset 13)
Upper Permian coal measures
For the Galilee subregion, the name ‘upper Permian coal measures’ refers to the Betts Creek beds, Bandanna Formation, Black Alley Shale, Peawaddy Formation and Colinlea Sandstone. Figure 9 and Phillips et al. (2015) show that the Betts Creek beds are the lateral equivalent of the Bandanna Formation, Black Alley Shale, Peawaddy Formation and Colinlea Sandstone. Further detail on upper Permian stratigraphic units can be found in Phillips et al. (2015, 2016), Nicoll et al. (2015), companion product 1.1 for the Galilee subregion (Evans et al., 2014), McKellar and Henderson (2013), Blanco (2010), Allen and Fielding (2007), Scott et al. (1995), Scott and Hawkins (1992), Wells (1989) and references listed in Table 3.
Within the upper Permian coal measures, individual coal seams will merge and split depending on local geological factors such as subsidence rates, compaction and sediment influx at the time of coal deposition. Up to seven major coal seams designated A to G, have been delineated in the upper Permian coal measures (Scott and Hawkins, 1992). Coal seams A and B were included in the Bandanna Formation. Recent work by Phillips et al. (2015, 2016) has identified further coal seam groups.
The coal seam nomenclature in Scott and Hawkins (1992) has been adopted by most coal companies operating in the Galilee Basin. However, whether a particular seam is included stratigraphically in the Betts Creek beds, the Bandanna Formation or Colinlea Sandstone varies between the different coal mine developments. For instance, at Hyde Park, seams A through to D2 are included in the Betts Creek beds, with seams D1 to G incorporated into the Colinlea Sandstone (Saul et al., 2015). At Carmichael Coal Project, seams A to C are included in the Bandanna Formation with seams D to F included in the Colinlea Sandstone (GHD, 2013). At Alpha, seams A and B are included in the Bandanna Formation with seams C to F included in the Colinlea Sandstone (Hancock Prospecting Pty Ltd, 2011). In South Galilee, however, seam D is included in the Bandanna Formation (SGCP, 2012). Other conventions of coal seam nomenclature based on CSG wells are adopted for some of the deeper parts of the Galilee Basin (Phillips et al., 2015). The variety of coal seam nomenclature can cause issues for correlation, which in turn influences the degree of detail and certainty that geology can be modelled on a semi-regional basis.
Phillips et al. (2015, 2016) suggest that at a semi-regional scale, there are issues that need to be addressed with correlations between the different stratigraphic units that comprise the upper Permian coal measures sequence.
Phillips et al. (2015, 2016) present a stratigraphic framework for correlation of coal seams across the entire Galilee Basin. Primarily using geophysical well logs and other drillhole data, Phillips et al. (2015) designated 11 major coal seams, A through K, with seams A and B in the Bandanna Formation and seams C to I in the Colinlea Sandstone. Seams J to K are newly recognised lithological subdivisions in the coal measures and are yet to be assigned to a stratigraphic unit. The Betts Creek beds included all seam packages. Phillips et al. (2015) then correlated the coal seams across the Galilee Basin using seam C as a distinctive marker horizon. Seams B to G, were found to occur across the Galilee Basin while Seam A was only found to occur around the eastern margin and central parts of the Koburra Trough. Seams H and I are localised to deep parts of the Koburra Trough. Seams J and K occurred along the western margin of the northern Galilee Basin, in particular in the Aramac Trough. According to Phillips et al. (2015), the variation in seams suggests there is compartmentalisation in the Galilee Basin possibly due to variations in tectonics, subsidence and differential compaction. Phillips et al. (2015) suggested that correlations presented in their study should be further tested using biostratigraphy and geochronology. Nicoll et al. (2015) reported on some preliminary age dating results that are part of these ongoing studies.
Due to limited available data for the individual stratigraphic units that comprise upper Permian coal measures and discrepancies between drillhole stratigraphic picks, only the top and base were modelled for the Galilee subregion geological model.
The upper Permian coal measures are unconformably overlain by the Rewan Group across much of the subregion (Figure 9). Around the north-eastern margin of the subregion the upper Permian coal measures are unconformably overlain by Warang Sandstone. Most of the Barcaldine High and the upper Permian coal measures, in parts of the southern Galilee Basin and along parts of the western margin of Galilee Basin respectively, are in direct contact with the overlying Eromanga Basin (specifically the Hutton Sandstone or Precipice Sandstone).
The upper Permian coal measures outcrop just east of the Great Dividing Range in the upper reaches of the Belyando river basin. However, most of the outcrop is obscured by a cover of Cenozoic sediment (see Section 2.1.2.2.5.1). Although the upper Permian coal measures occur throughout much of the Galilee Basin (Figure 22), drillhole data suggest they are missing along the western margin of the Galilee Basin and from much of the Lovelle Depression. The deepest intervals occur at a depth around 1800 m BSL in the Powell Depression. Further information on the distribution of individual stratigraphic units that comprise the upper Permian coal measures can be found in companion product 1.1 for the Galilee subregion (Evans et al., 2014) and Wells (1989). Figure 20 in Evans et al. (2014) outlines the general distribution of Betts Creek beds, Bandanna Formation and Colinlea Sandstone in the upper Permian coal measures. Wells (1989) outlined the distribution of all coal-bearing formations in the Galilee Basin as well as the Peawaddy Formation and Black Alley Shale. It is likely that these maps will be able to be refined in the future by referring to the work of Phillips et al. (2015, 2016) and by utilising recent company CSG and coal drilling data.
Overall, Figure 22 demonstrates that the top of the upper Permian coal measures have westerly and southerly dip direction patterns, which is similar to what occurs in the overlying Rewan and Clematis groups (Figure 18, Figure 20). However, in the structure contours it is evident that there is more complexity (Figure 22). Part of the reason why there is more complexity could be because existing seismic mapping was incorporated into the development of Figure 23 (Section 2.1.2.2.4). The presence of significant thicknesses of coal makes the top of the upper Permian coal measures a relatively easy horizon to pick from seismic techniques (Marsh et al., 2008). Some of the complexity in Figure 23 involves a series of north-easterly trending troughs and highs (e.g. the Aramac Trough) near the western margin of the northern Galilee Basin. These troughs and highs are separated from the Koburra Trough by the North Galilee Rise (Section 2.1.2.2.3). In the southern Galilee Basin, the south-west trending Pleasant Creek Arch and Warrego Fault are prominent and segregate the Powell Trough from Springsure Shelf. Also evident are some of the south-west trending fold closures on the Springsure Shelf and the complicated nature of the Barcaldine Ridge (see also Section 2.3.2 of companion product 2.3 for the Galilee subregion (Evans et al., 2018)).
The upper Permian coal measures are much thinner south of the Barcaldine Ridge compared to north of it (Figure 23). Overall the upper Permian coal measures have a mean thickness of around 93 m with 90% of it being less than 162 m in thickness (Table 6). It reaches a maximum of around 210 m in thickness in southern sections of Koburra Trough and in the Aramac Depression. In the central Lovelle Depression, the upper Permian coal measures steadily thicken to a maximum of 125 m. In other areas, the upper Permian coal measures thin considerably, to generally less than 50 m.
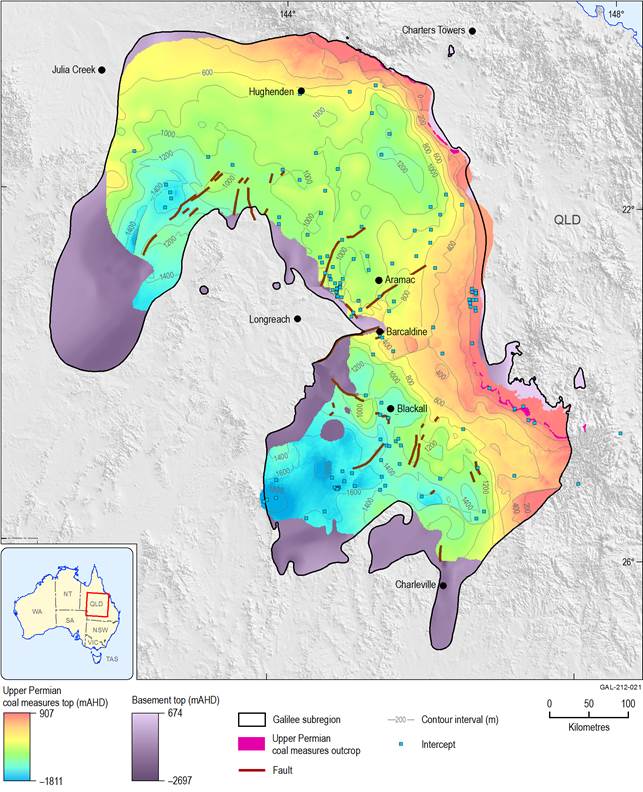
Figure 22 Elevation of the top of the upper Permian coal measures in the Galilee Basin
Data: Bioregional Assessment Programme (Dataset 34)
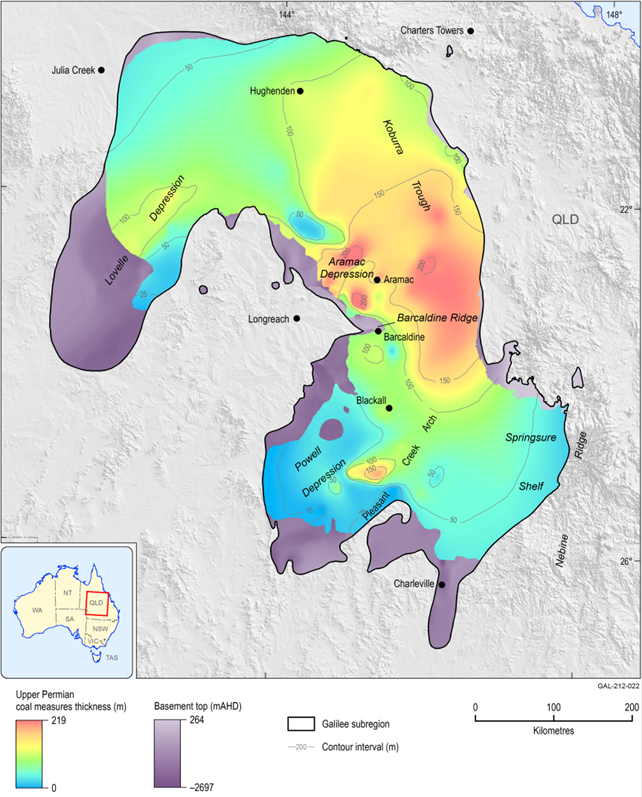
Figure 23 Extent and thickness (m) of the upper Permian coal measures
Data: Bioregional Assessment Programme (Dataset 13)
2.1.2.2.5.4 Distribution of coal seam gas in the upper Permian coal measures
While many aspects of CSG studies are beyond the scope of the BA, some information is pertinent as it has a bearing on the formation and distribution of gas in Galilee subregion. This in turn may provide additional information on the hydrodynamics of the Galilee Basin groundwater systems and for the qualitative risk and impact analysis that will be reported in companion products 3 and 4 of the BA for the Galilee subregion. Further discussion on CSG and its possible relationship with groundwater systems in the Galilee Basin is provided in Section 2.3.2.2.2 of companion product 2.3 for the Galilee subregion (Evans et al., 2018). I’Anson (2013) investigated various aspects of coal and CSG from the upper Permian and Aramac coal measures in the Galilee Basin. More data have become available since the publication of I’Anson (2013). Relevant aspects of some CSG data that were collated for the BA for the Galilee subregion are outlined below.
The CSG content from a drill core sample is typically reported as raw gas content. If additional information such as the moisture content and inert mineral content (ash) of the coal from which the gas has been extracted is available, then the raw gas content value can be standardised to a dry ash free (DAF) gas content. Standardisation allows for a more direct comparison of gas content data from different seams and regions. For the BA for the Galilee subregion, DAF gas contents are used for comparison, as samples from different seams but within the same coal-bearing sequence are being clumped into two broad groups. The two broad groups are the upper Permian coal measures and Aramac coal measures.
I’Anson (2013) showed that vitrinite reflectance for upper Permian coal measures ranges from around 0.4 to 0.8 %Ro, while for the more deeply buried Aramac Coal Measures the vitrinite reflectance range from 0.5 to 0.9 %Ro. In the upper Permian and Aramac coal measures the highest DAF gas content from drill core samples occur between 900 and 1200 m (Figure 24). Gas content decreases significantly below 1300 m. The apparent increase in gas content below 1600 m (Figure 24) may relate more to the coal samples having a tendency towards higher ash contents, rather than the raw gas content actually beginning to increase again with depth. A discrete peak in gas content is one line of evidence that is suggestive that the gas was largely derived through a biogenic pathway. Such a distribution has been observed in other coal-bearing basins, for example Sydney Basin (Burra et al., 2014) and Surat Basin (Hamilton et al., 2015). However, unlike in the previous examples, there do not appear to be an obvious conceptual flow pathways that could connect groundwater recharge to areas in the Galilee Basin where higher CSG contents are present in the upper Permian coal measures (see also Section 2.3.2.2.2 of companion product 2.3 for the Galilee subregion (Evans et al., 2018)).
CSG is produced primarily via two major processes: biogenic (microbial) or thermogenic (geological) pathways. Hamilton et al. (2012) and Golding et al. (2014) detailed a number of discriminating factors that can be used to determine the origins of CSG. These include gas composition, thermal maturity of the coal and the isotopic composition of carbon and hydrogen in methane and other gases that make up the CSG. Detailed analysis of all these aspects was not required for the BA. The only discriminant considered here is the carbon isotopic composition of methane. According to Golding et al. (2014), a δ13C value of –50 approximates the boundary between biogenic and thermogenic gas. CSG can be described as having a biogenic, mixed or thermogenic origin.
As shown in Figure 25, carbon isotope data for the methane component of CSG from the Galilee subregion is sparse. Available data suggests that CSG from upper Permian and Aramac coal measures is primarily biogenic to mixed-biogenic origin above 1400 m. Limited sampling from below 1600 m suggests that, at deeper levels, CSG has more of a thermogenic origin. In general, gases of biogenic origin are thought to be associated with topographic-driven groundwater systems (Burra et al., 2014; Hamilton et al., 2015) rather than groundwater systems driven by other geological pressure regimes (e.g. over-pressurisation due to gas at depth). The lower CSG contents found between 1300 to 1600 m also support the interpretation that CSG is biogenic rather than thermogenic and that the system has not been pressured by gas sources from deeper levels in the coal seams.
Figure 26 shows the variation in the distribution of the average CSG gas content for upper Permian coal measures. Higher average gas contents tend to be clustered in the vicinity of CSG project areas (Figure 26) in central parts of the northern Galilee Basin. Overall, however, a zone of higher gas content forms a north-east trending fairway. I’Anson (2013) also noted a similar gas content trend in the upper Permian coal measures. The zone of higher gas contents appears to butt up against the Maneroo Platform, along the western margin of Galilee Basin. Faults that are known to occur have also been overlain on Figure 26. Many of these faults have a near-parallel trend to CSG fairway, which suggests some structural control is influencing the distribution of the gas. In Figure 26, the north-east trending fault along the southern margin of the gas fairway appears to form a boundary between high and low gas contents, which suggests that there is some compartmentalisation in the coal measures. This may also have some bearing on potential for groundwater flow. As shown in Section 2.3.2.2.2 of companion product 2.3 for the Galilee subregion (Evans et al., 2018), the potential groundwater flow direction is parallel to some faults as well as the trend in higher gas contents (the gas fairway) in the upper Permian coal measures. Evans et al. (2016) postulated that structures and hydrodynamics may be influencing the distribution of CSG. In turn, the CSG distribution suggests that some compartmentalisation of the reservoir is apparent in the upper Permian coal measures, which may locally influence the hydrodynamics of this unit.
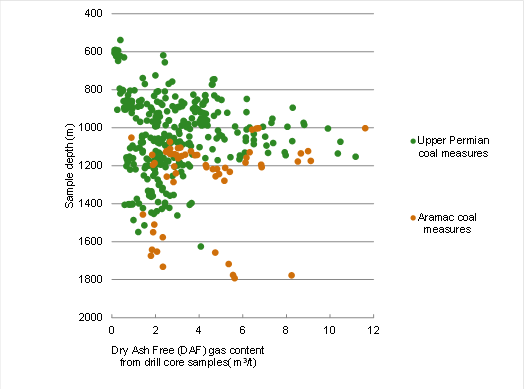
Figure 24 Dry Ash Free gas contents for upper Permian and Aramac coal measures relative to depth
Data: Bioregional Assessment Programme (Dataset 35)
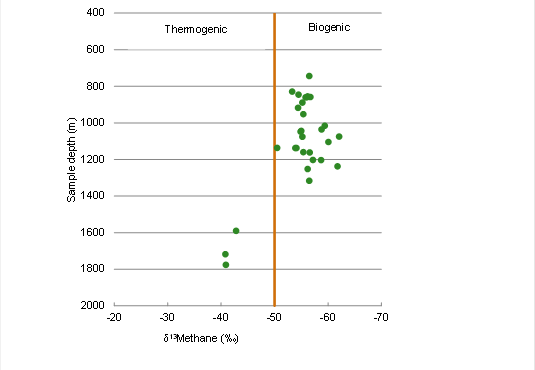
δ13Methane is a measure of the isotopic composition of the Carbon (C) atom in the methane molecule. δ13C is the ratio of 13C to 12C isotopes of the carbon in the methane gas, relative to the isotopic ratio of 13C to 12C in a standard reference material. As described in the text, a δ13C value less than –50 indicates a biogenic origin for the methane.
Data: Bioregional Assessment Programme (Dataset 35)
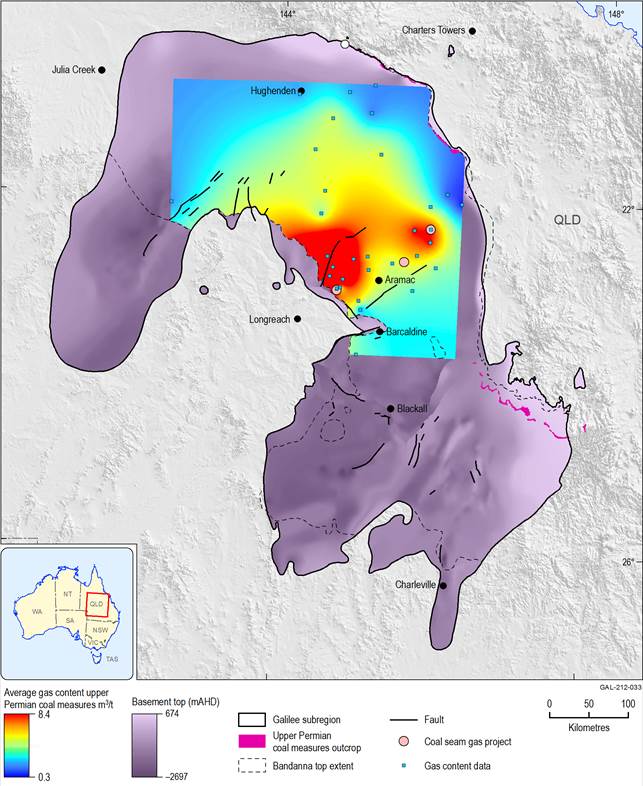
Figure 26 Distribution of average gas contents for the upper Permian coal measures
Data: Bioregional Assessment Programme (Dataset 36)
Joe Joe Group
The Late Carboniferous to early Permian Joe Joe Group represents the lowermost stratigraphic sequence in the Galilee Basin. It was in part deposited in glacial, fluvial glacial and lacustrine environments. Figure 9 outlines the stratigraphy for the Joe Joe Group, which is comprised of four main stratigraphic units. These are the: Lake Galilee Sandstone, Jericho Formation, Jochmus Formation and the Aramac Coal Measures. The Edie Tuff Member occurs in the upper part of the Jochmus Formation while the Oakleigh Siltstone Member is a part of the Jericho Formation. The Boonderoo beds are a basin margin facies restricted to the north-eastern margin of the Galilee Basin.
For the purposes of the BA for the Galilee subregion, the Joe Joe Group was modelled as one unit as most coal mine projects (the exception being coal mine projects in the Winton Formation) are situated stratigraphically above the Joe Joe Group, in units that comprise the upper Permian coal measures (see companion product 1.2 for the Galilee subregion (Lewis et al., 2014)). The Aramac Coal Measures, while an exploration target for CSG, are yet to be included in a declared CSG gas resource. Further detail on the Joe Joe Group is available from Phillips et al. (2015), Nicoll et al. (2015), companion product 1.1 for the Galilee subregion (Evans et al., 2014), McKellar and Henderson (2013), Jones and Fielding (2008), Scott et al. (1995) and references listed in Table 3.
The Joe Joe Group has the broadest extent across the Galilee Basin. It outcrops along the eastern margin of the Galilee subregion, east of the Great Dividing Range in the Burdekin river basin. The top of the Joe Joe Group (Figure 28) is at its deepest in the main depocentres – the Koburra Trough, the Lovelle Depression and the Powell Depression at respectively around 1200 m, 1700 m and 1800 m BSL. The Aramac Trough is another prominent depression situated near the western margin of the northern Galilee Basin. Overall, it has a westerly to southerly dip from its eastern and northern margins into the Galilee Basin.
The Joe Joe Group has a highly variable thickness, which locally reflects its infill of irregular terrain and the influence of basin-forming tectonic events in the early Permian. Erosion and uplift that occurred during the Permian but post deposition have also modified the distribution and thickness of the Joe Joe Group. There is more structural complexity in the top of Joe Joe Group (Figure 27 ), when compared with others (e.g. Figure 18, Figure 20, Figure 22) as the various depo-centres within the Galilee Basin were at their most active during deposition of the Joe Joe Group. The Joe Joe Group is thickest in the Koburra Trough (over 1600 m thick). It also exceeds 1000 m thickness over parts of the Barcaldine Ridge, northern parts of the Springsure Shelf and bits of the Aramac Trough.
However, the Joe Joe Group is generally less than average thickness in the Powell and Lovelle depressions. Overall, the Joe Joe Group has a modelled mean thickness of 466 m and 90% of it is less than 1079 m thick (Table 6).
Table 5 outlines statistics based on drillhole data for the various stratigraphic units that comprise the Joe Joe Group. The various stratigraphic units that comprise the Joe Joe Group are not distributed evenly across the basin (Scott et al., 1995). The Lake Galilee Sandstone is restricted to eastern and central parts of the Koburra Trough. The Jericho and Jochmus formations are more widespread; the Jochmus Formation is commonly the basal sequence across much of the Galilee Basin.
The Aramac Coal Measures has limited extent in the northern Galilee Basin, from the mid-region of the Lovelle Depression, around the Maneroo Platform into the Aramac Depression, and eastwards into the western margin of the Koburra Trough. There are varying views that the distribution of the Aramac Coal Measures has been either the uppermost eroded remnant of the Joe Joe Group, or that it is largely controlled by syndepositional structural movements, with the thickest coal seams accumulated in fault-controlled grabens and half-grabens (Scott and Hawkins, 1992; Scott et al, 1995). The drillhole data (Table 5) indicate that although it can be up to 272 m in thickness in the Lovelle Depression, it has a mean thickness of 106 m with 90% of drillhole intercepts being less than 194 m in thickness.
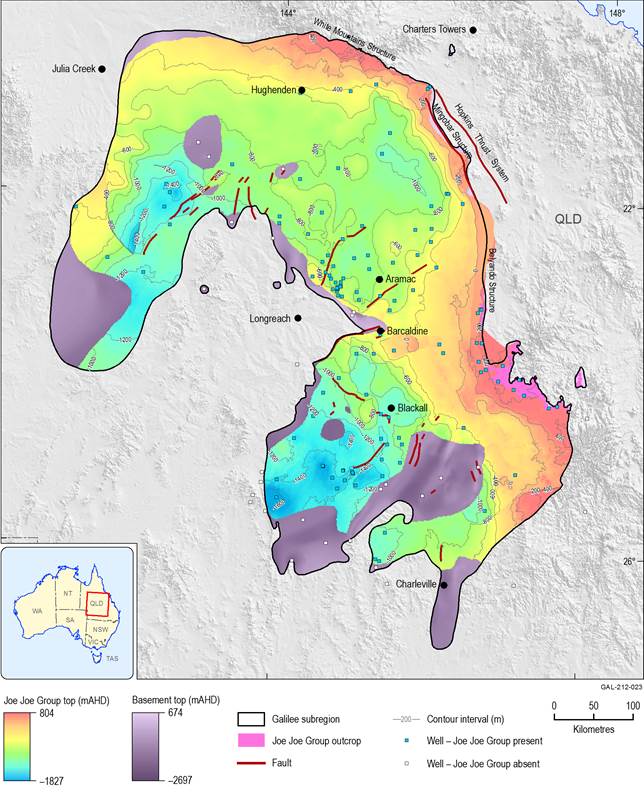
Figure 27 Depth to top of the Joe Joe Group in the Galilee Basin
Data: Bioregional Assessment Programme (Dataset 13)
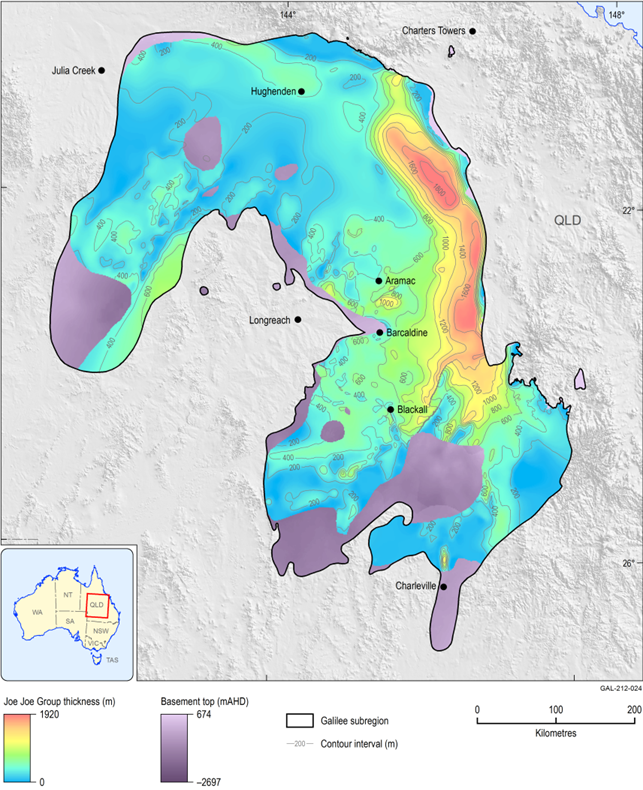
Figure 28 Extent and thickness of the Joe Joe Group in the Galilee Basin
Data: Bioregional Assessment Programme (Dataset 13)
Top of basement
The top of basement surface is represented by structural contours of the base of the Galilee Basin (Figure 29). Basement rocks outcrop to the east of the Galilee subregion. Many of the faults that are evident in basement do not necessarily have surface expression. However, many faults have repeatedly influenced deposition and erosion through their reactivation at various stages during the history of basin development in the Galilee subregion (companion product 1.1 (Evans et al., 2014)).
The three main depocentres for the Galilee Basin form prominent depressions in the top of basement. Along parts of the eastern margin of the Galilee Basin, depth to basement drops significantly into the Koburra Trough with the deepest areas being in the order of 2600 m BSL. The southern margin of the Koburra Trough may terminate against the Warrego Fault and Pleasant Creek Arch.
In the northern Galilee Basin, the Aramac Trough and Barcaldine Ridge are also prominent, as are the complex series of basement highs associated with the north-eastern margin of the Maneroo Platform. In the southern Galilee Basin, a series of faults bound the north-eastern margin of the Powell Depression, whereas the Warrego Fault and Pleasant Creek Arch cross-cut the basin just to the south-east of Blackall.
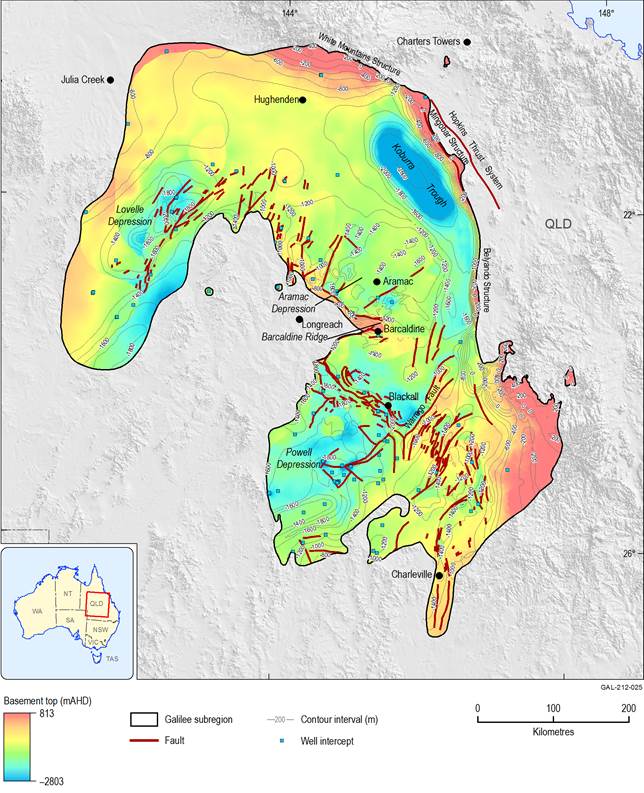
Figure 29 Depth to basement of the Galilee Basin
Data: Bioregional Assessment Programme (Dataset 13)
2.1.2.2.5.5 Combined geological model sections and uncertainty
In Figure 30a, the Galilee Basin sequence is overlain by rocks of the Eromanga Basin and superficial Cenozoic sediments. The Eromanga Basin sequence can be up to 1 km thick with the recharge beds for the Eromanga Basin aquifers outcropping at the north end of section (Figure 30). Additionally, the Rewan Group is missing and upper Permian Coal measures are directly overlain by Clematis Group and the Moolayember Formation. Heading south into the Galilee Basin, the Rewan Group occurs but the Moolayember Formation thins out. In the far south the edge of the Galilee Basin is faulted out against the Maneroo Platform and thus Eromanga Basin sequences are resting on basement rocks (Maneroo Platform).
Figure 30b and Figure 30c are cross-sections from the western Galilee Basin margin across the Koburra and Aramac troughs, to the eastern margin of the Galilee subregion. The Koburra and Aramac troughs are separated by the North Galilee Rise (Section 2.1.2.2.3). Near the eastern edge of Figure 30b, the upper Permian coal measures, Rewan Formation and Clematis Group outcrop to the east or near the crest of the Great Dividing Range. West of the Great Dividing Range the outcrop is dominated by Moolayember Formation until the edge of the Eromanga Basin is reached around the centre of the section. Here, the recharge beds for the GAB outcrop. Recharge bed outcrop (Figure 30b) consists predominantly of Hutton Sandstone and Cadna-owie – Hooray Sandstone. Further west the recharge beds are buried by the Wallumbilla Formation and the Winton-Mackunda formations. In the far south-west the Galilee Basin margin is faulted against the Maneroo Platform by the Hulton–Rand Structure (Section 2.1.2.2.3).
Figure 31 includes two cross-sections located in the southern Galilee Basin. Figure 31a runs from the eastern margin of the Galilee Basin through the Powell Depression to terminate near the Canaway Fault. Outcrop of Galilee Basin sedimentary rocks occurs east of the Great Dividing Range on the Springsure Shelf (Section 2.1.2.2.3). At depth most of the Galilee Basin sedimentary fill consists of Joe Joe Group. Once off the Springsure Shelf the Rewan Group is largely missing and the upper Permian coal measures pinch out as they go into the Powell Depression. Most of the sedimentary fill in the Powell Depression consists of Eromanga Basin strata, in particular the Winton-Mackunda and Wallumbilla formations.
Figure 31b runs from north-west to south-east across the Powell Depression. The Galilee Basin sequence is relatively thin and partially preserved in fault-bounded blocks beneath a thick sequence of Eromanga Basin sedimentary rocks. Faults in this section appear to not have been active after the deposition of Galilee Basin sedimentary rocks. There are areas where upper Permian coal measures and Clematis Group are in direct contact with base of the Eromanga sequence. The whole Galilee subregion sedimentary sequence has been deformed into a series of open folds east of the Pleasant Creek Arch.
Figure 32a presents a regional section along the Koburra Trough and the eastern margin of the Galilee subregion. The main feature is the Koburra Trough with late Permian sedimentary packages dipping into it from the north and the south. On the northern flank of the Koburra Trough, the Rewan Group pinches out allowing the Clematis Group (probably Warang Sandstone) to be in direct contact with upper Permian coal measures.
Figure 32b is a regional section, running along the western margin of the Galilee subregion, then once south of the Barcaldine Ridge, it cuts across the trends of major structures in the southern Galilee Basin. The Barcaldine Ridge (Figure 23b) forms the boundary between northern and southern Galilee Basin. On the Barcaldine Ridge itself, much of the Galilee Basin sequence is missing, allowing upper Permian coal measures to be in direct contact with the Hutton Sandstone. On either side of the ridge the full Galilee Basin sequence is present. However, it is significantly thicker north of the Barcaldine Ridge than it is to the south. This suggests that the Barcaldine Ridge structures were active during deposition of the upper Permian and Triassic Galilee Basin sequences. Another feature of interest is the three jagged ‘peaks’ in the basement, north of the Aramac Depression. These ‘peaks’ are the fault-bound ridges that run northwards off the Maneroo Platform (Marathona Monocline, Darriveen Structure and Beryl Ridge). The upfaulted block in the far northern part of the section is associated with the Cork Fault and the Wetherby Terrace.
Figure 32c is a long-section down the Lovelle Depression. Here the Galilee Basin sequence is relatively thin when compared to other parts of the Galilee Basin. The upper Permian coal measures do not occur in much of the Lovelle Depression. Much of the sedimentary fill in the Lovelle Depression is assigned to the Eromanga Basin, in particular the Wallumbilla Formation and Winton-Mackunda formations.
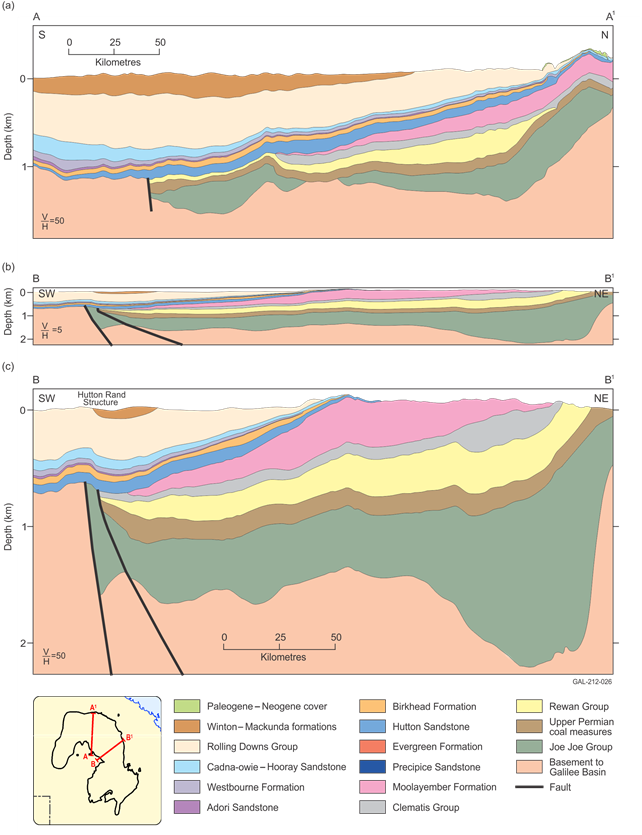
Figure 30 Regional cross-sections for the northern parts of the Galilee subregion
Data: Bioregional Assessment Programme (Dataset 13)
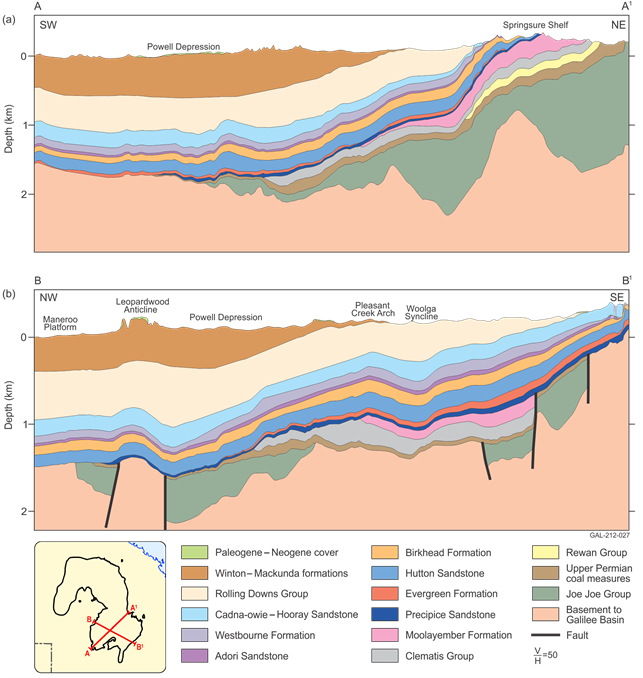
Figure 31 Regional cross-sections for the southern portions of the Galilee subregion
H = horizontal, V = vertical
Data: Bioregional Assessment Programme (Dataset 13)
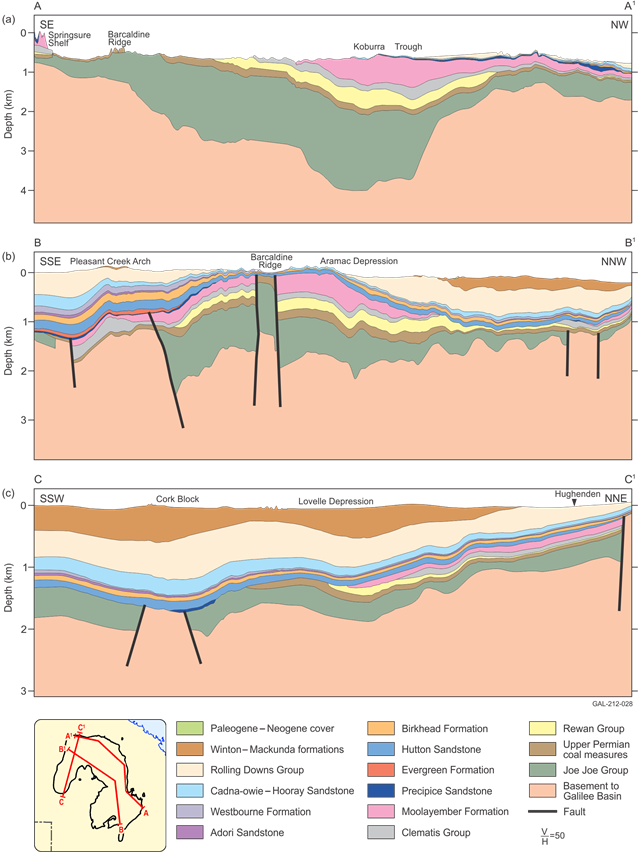
Figure 32 Regional long sections for the Galilee subregion
(a) cross-section A to A1. Eastern margin of the Galilee subregion (section looking to the south-west)
(b) cross-section B to B1. Centre of the Galilee subregion (section looking to the south-west)
(c) cross-section C to C1. Lovelle Depression (section looking to the north-west)
Data: Bioregional Assessment Programme (Dataset 13)
2.1.2.2.5.6 Eromanga–Galilee three-dimensional geological model: limitations and uncertainty
A stratigraphic model was originally constructed for the Galilee Basin from basement upwards because the templates of basement faults and an interpreted magnetic basement surface (OZ SEEBASE) were already available. The OZ SEEBASE surface is an interpretation of depth to magnetic basement which, apart from intrusions, may occur at various stratigraphic levels within the geological basement itself. The implication is that in the absence of other data, such as seismic interpretation or drillhole intercepts, the OZ SEEBASE basement surface won’t always coincide with the actual interface between overlying sedimentary basins and geological basement. A basement surface for the Galilee Basin was developed from the OZ SEEBASE basement surface through depth correction from drill data and/or available seismic interpretation.
When the isopach data for the Eromanga Basin sequence was later added and compiled from ground surface downwards to the first iteration of the modelled Galilee stratigraphic layers, it became apparent that there were disparities in the order of hundreds of metres, between the top of Galilee and base of Eromanga basins. As a result, it was decided to compile all layers of Eromanga and Galilee basins from the ground surface down to the top of geological basement (bottom of the Galilee Basin). This resulted in a second iteration of all Galilee stratigraphic layers as well as geological basement.
It was found that utilising the top down approach minimises the introduction of errors from the OZ SEEBASE dataset. Also, uncertainty would increase with depth in part due to a decrease in drillhole data reaching a maximum value at the base of the model (top of basement). Confidence in geological modelling would be lowest at depth in areas where there is little drillhole data or seismic mapping. Confidence would be higher at shallower levels, in areas with higher density of drillhole data and seismic coverage.
As an example of an estimate of uncertainty, the two top of basement surfaces for the Galilee Basin – one generated from the basement up and the other from the ground surface down approach – were compared to generate a percentage of uncertainty. Accordingly, this level of uncertainty is a ‘worst case scenario situation’ as geological basement is the deepest layer.
One uncertainty that remains in the top-down approach to modelling was the estimation of thickness of Cenozoic (Quaternary) sediments. These data are not available from the GAB Atlas (Ransley et al., 2015). However, anticipated error in estimation of the Quaternary thickness is an order of magnitude lower than prediction error at the basement to the Galilee Basin.
The level of confidence of the subsurface extent of the Galilee Basin and individual units within the sequence is variable to low in the south-east and north-west (Figure 33). Seismic reflection survey lines are mainly clustered in the Powell Depression, the margin of the Maneroo Platform and around to the central region of the Lovelle Depression. Only a few seismic reflection survey lines traverse the Koburra Trough (Figure 33). Along the margins of the Galilee Basin the category of higher relative uncertainty is mostly the result of little or no publicly available data, as well as increased relative error at shallow depth.
Predictably for areas with sufficient data, the disparity between the two approaches is minimal, although significant disparities exist in data-poor areas. If required, stratigraphic data gaps in data poor areas could be decreased through the drilling of stratigraphic wells or undertaking geophysical surveys such as seismic reflection surveys.
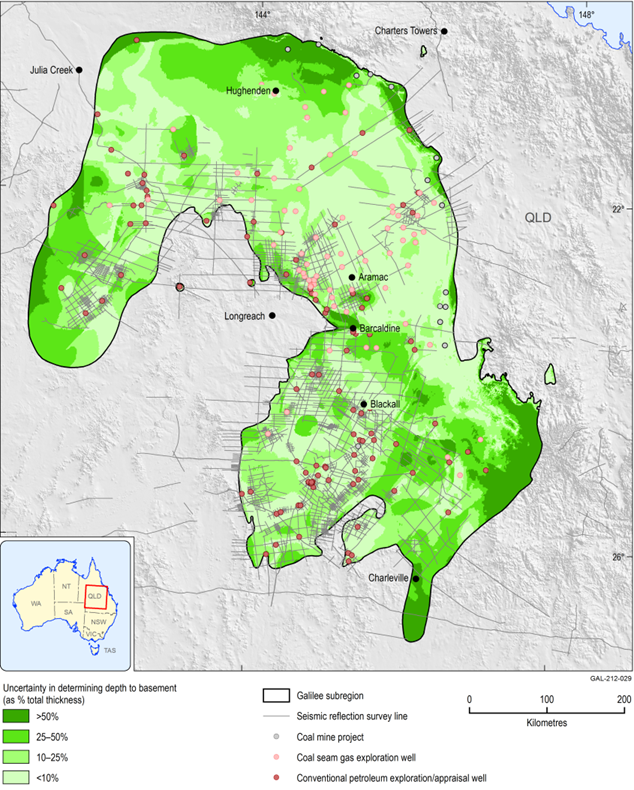
Figure 33 An estimate of modelling uncertainty for top of Galilee basement
Uncertainty in the estimate of depth to basement is presented as a percentage difference in depth estimates between modelling geological layers by the basement-up and from the top-down approach. Where reliable data sources, such as deep drillholes or seismic reflection surveys are present, the results of the two approaches are very similar.
Data: Bureau of Meteorology (Dataset 1), Bioregional Assessment Programme (Dataset 13)
