Groundwater resources in the Namoi are the most intensively developed in NSW and the subregion has one of the highest levels of groundwater extraction within the MDB (CSIRO, 2007). There are over 18,000 bores in the Namoi catchment which are licensed to provide over 343,000 ML of groundwater entitlement per year. Aquifer licences cover a variety of purposes including irrigation, industrial, stock and domestic water.
Over-allocation of the alluvial aquifers in the past has led to the Namoi being included in the Achieving Sustainable Groundwater Entitlements program; a program to reduce allocation in key inland catchments in NSW. The program is being implemented through the water sharing plans in the region as discussed above, and by 2016 will result in a reduction of the groundwater allocation in the Upper Namoi groundwater source of almost 60% (179,800 ML/year) and in the Lower Namoi groundwater source of 50% (86,200 ML/year) (MDBA, 2012).
Figure 32 below shows annual groundwater usage in the Lower Namoi from 1991–92 to 2007–08 with predicted water use based on the annual extraction limit set by the water sharing plan. Groundwater use in the Lower Namoi groundwater source has fluctuated significantly since 1991, ranging from approximately 45,000 ML in 1998–99 to 165,000 ML in 1994–95, usually in response to rainfall variability and the associated variability in surface water and groundwater use. In the Lower Namoi a combined total of 228,999 ML was pumped in the two seasons 2006–07 and 2007–08. Groundwater use was high in these years due to the low availability of surface water as a result of the Millennium drought. Groundwater use between 2008–09 and 2012–13 has been considerably lower than the early 2000s, ranging from approximately 30 to 80 GL. This is likely to be a result of in the introduction of the water sharing plan, limiting the amount of water irrigators can extract, and higher rainfall resulting in greater availability of surface water and reduced additional water requirements for irrigation.
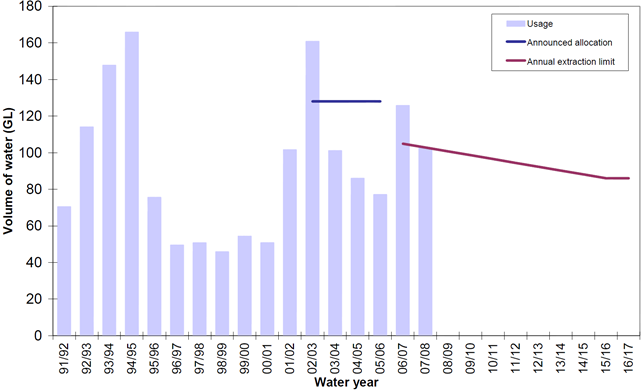
Figure 32 Lower Namoi groundwater usage since 1991-92
Source: Figure 3 in Smithson (2009).This figure is not covered by a Creative Commons Attribution. It has been reproduced with permission from NSW Department of Primary Industries.
There are approximately 1100 production bores in the Upper Namoi groundwater source, all of which are metered with usage recorded two to six times a year (Barrett, 2010). A comparison of annual groundwater usage since 1997–98 against the estimated average annual recharge for all zones in the Upper Namoi groundwater source is presented in Figure 33. Groundwater use in the Upper Namoi has varied significantly, ranging from approximately 55,000 ML in 2010–11 to 147,000 ML in 2001–02. Similar to the Lower Namoi, this variability has been driven by the rainfall pattern and associated availability of surface water, and the introduction of the water sharing plan. Usage across the Upper Namoi groundwater source has generally been well below the estimated average annual recharge since 2007–08.
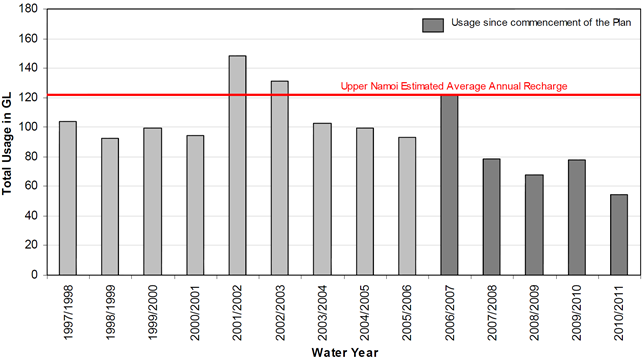
Figure 33 Total groundwater use in the Upper Namoi groundwater source 1997-98 to 2010-11
Source: Figure 4 in Barrett (2012)
A comparison of annual groundwater usage against the water sharing plan’s extraction limits for the groundwater source of the Upper Namoi is provided in Table 9 (see Figure 34 for zone locations). Usage in Upper Namoi Zones 2, 3 and 5 was close to or greater than the plan extraction limit for 2006–07. However since the first year of the plan, both the water available for extraction and the annual usage in these zones have been declining. Since the plan began, the three-year average usage for all the zones in the Upper Namoi has been well below the extraction limits, attributed to a combination of wetter climatic conditions and greater availability of surface water, and the introduction of the water sharing plan.
Table 9 Comparison of annual groundwater usage against the water sharing plan extraction limits for zones in the Upper Namoi groundwater source (in ML)
EXTLIM – Extraction limit
SWAL – Supplementary water access licences
WSP – Water sharing plan
Source data: Table 3 in Barrett (2010)
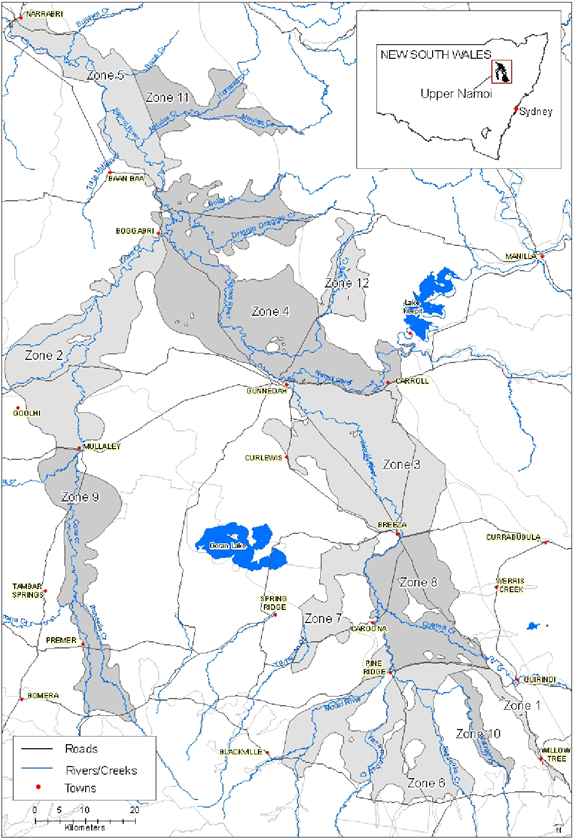
Figure 34 Upper Namoi groundwater source zones
Source: NSW Department of Environment, Climate Change and Water (Barrett, 2010)
