The surface water flow in the Gippsland Basin bioregion originates from four river regions (South Gippsland, Mitchell–Thomson, Snowy and East Gippsland) by its numerous headwater streams. Each of these river regions are characterised by large variations in discharge and flow duration. There are a large number of streamflow monitoring stations across the Gippsland Basin bioregion. A list of end-of-system stream gauges for major watercourses in the Gippsland Basin bioregion along with mean annual flow (MAF) and mean annual runoff (MAR) is given in Table 18. Details of the streamflow characteristics of different river regions that are included in the Gippsland Basin bioregion are described in the subsequent sections.
Table 18 List of stream gauges in the Gippsland Basin bioregion located in four river basins that are part of Gippsland Basin bioregion hydrological study
Source: Department of Environment and Primary Industries (2014b). Mean annual flow statistic sourced from Bureau of Meteorology (2014)
Water in the South Gippsland River Region is derived from several small river catchments within the bioregion. The average runoff varies from 52 mm for the Merriman Creek at Prospect Road Seaspray to 254 mm for the Tarwin River at Meeniyan. Although most streams in the South Gippsland River Region are perennial, streamflow varies between years and months. Figure 39 shows an example of yearly and monthly flow distribution based on observed streamflow at Meeniyan for the period of 1989 to 2013. MAF between the periods from 1989 to 2013 varies from 65 to 457 GL with a mean of 235 GL. Mean monthly flow varies from 2.5 to 51 GL with about 84% of the annual flow occurring from June to October.
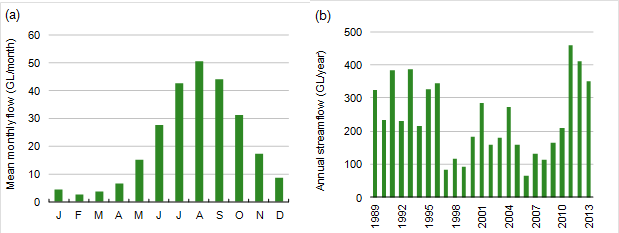
Data: Bioregional Assessment Programme (Dataset 5)
Water in the Mitchell–Thomson River Region is predominantly derived from runoff from headwater catchments. The average runoff across the river region varies from 41 mm for the Nicholson River at Sarsfield to 502 mm for the Latrobe River at Kilmany South. Streamflow in Mitchell–Thomson River Regions varies between years from very small flow to large flooding, and between months. Figure 40 shows an example of yearly and monthly flow distribution based on gauge data for the period of 1980 to 2013 at Glenaladale on the Mitchell River. MAF at Glenaladale varies from 123 to 1394 GL with a mean of 724 GL. Mean monthly flow varies from 16 to 138 GL between the months with 78% of the annual flow occurring from June to October.
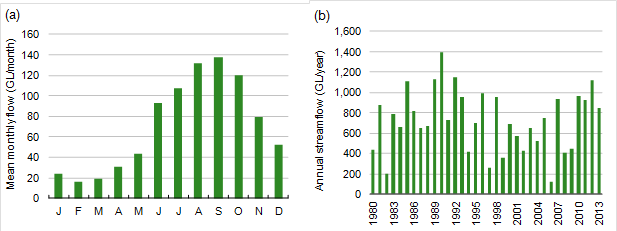
Data: Bioregional Assessment Programme (Dataset 5)
Water in the Snowy River Region is predominantly derived from runoff from the headwater catchments of the Snowy River, located outside the bioregion. The runoff across the river region varies based on location within the river region. The mean annual runoff for a headwater catchment at Bombala is 89 mm and it is 68 mm at a downstream gauge at Jarrahmond on the Snowy River. Streamflow varies between years and months. Figure 41 shows an example of yearly and monthly flow distribution based on observed streamflow data at Sardine Creek on the Brodribb River in the Snowy River Region. MAF between the periods from 1980 to 2013 varies from 27 to 308 GL with a mean of 98 GL. Monthly flow varies from 5 to 20 GL with about 67% flow occurs during June to October.
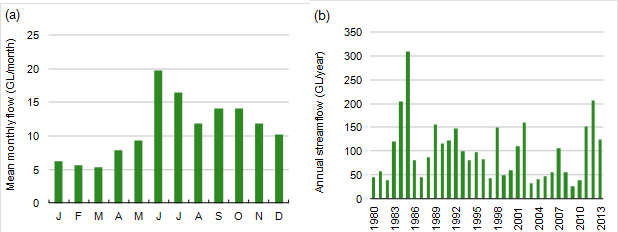
Data: Bioregional Assessment Programme (Dataset 5)
The source of water in the East Gippsland River Region that is part of Gippsland Basin bioregion originates in the headwaters of the Bemm and Cann rivers. Only the Bemm and Cann rivers of the East Gippsland River Region contribute surface water to the Gippsland Basin bioregion. The annual average runoffs are 131 mm and 168 mm for the Bemm river basin at pump house (GS 221225) and the Cann river basin at Offtake (GS 221224), respectively. All across the river region, streamflow varies between years and months. A typical example of monthly and annual flow distribution is shown in Figure 42. MAF between the periods from 1980 to 2013 varies from 48 to 417 GL with a mean of 160 GL. Monthly flow varies from 6 to 27 GL, 75% of the mean annual flow occurred during June to October.
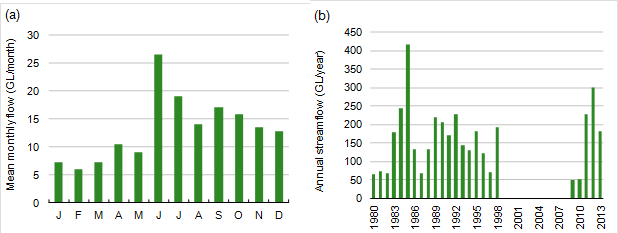
Data: Bioregional Assessment Programme (Dataset 5)
Information on water availability and entitlements is available for all major watercourses in the Gippsland Basin bioregion. Table 19 shows the annual average volume of surface water availability for consumptive use and water that remains in each river region for the environment. It is based on long-term annual averages of about 50 years of data reported in Department of Environment and Primary Industries (2011). It is important to note that because these are annual average estimates, the volume of use or streamflow in any one year is unlikely to match the annual average. Actual use and streamflow will vary from year to year with climate variability and the historical take-up of entitlements. The estimates in the table reflect an upper limit that could be taken under the entitlements, rather than historical use.
Table 19 Surface water availability and usage for the river regions in the Gippsland Basin bioregion
Source: Department of Environment and Primary Industries, Victorian Government.
Note: Bulk entitlement includes unban, industrial and irrigation usage
