The climate across the Gippsland Basin bioregion is influenced by the geography, topography, elevation and distance from the coast. The climate is considered temperate under the Koppen-Geiger climate classification scheme (Koppen-Geiger classification, dataset 9). Within the bioregion the climate is monitored from 263 weather stations (Bureau of Meteorology, 2014).
1.1.2.3.1 Rainfall and aridity
The mean long-term annual precipitation across the bioregion is 835 mm (Figure 11). The Great Dividing Range to the north has a significant influence on the rainfall and weather patterns of the bioregion, and contributes to the rain-shadow in the Mitchell and Tambo river valleys, and the Gippsland plains from Sale to Bairnsdale (Joint Commonwealth and Victorian Regional Forest Agreement Steering Committee, 1999). As a result, these areas receive on average 500 to 700 mm rainfall annually.
Figure 12 shows the mean annual rainfall for the entire bioregion. Although there is no dry season, the maximum rainfall on average occurs during winter and spring, with the least seasonal variation apparent in the low-lying plains (Joint Commonwealth and Victorian Regional Forest Agreement Streering Committee, 1999).
The Gippsland plains and lower-lying areas are prone to flooding during high rainfall events. Flood events in 1998 and 1971, and severe storms in 2007 are estimated to have cost the region $3, $53 and $18 million respectively (Insurance Council of Australia, 2014). Increases in population in the coming decades are predicted to lead to increases in the costs when disasters do occur in the region (Foster H, 2013).
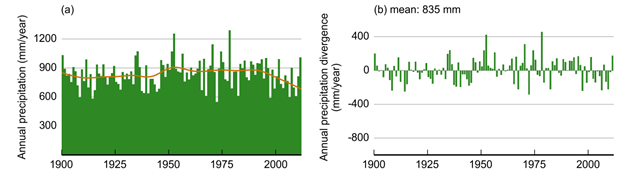
Data: CSIRO Land and Water (Dataset 10)
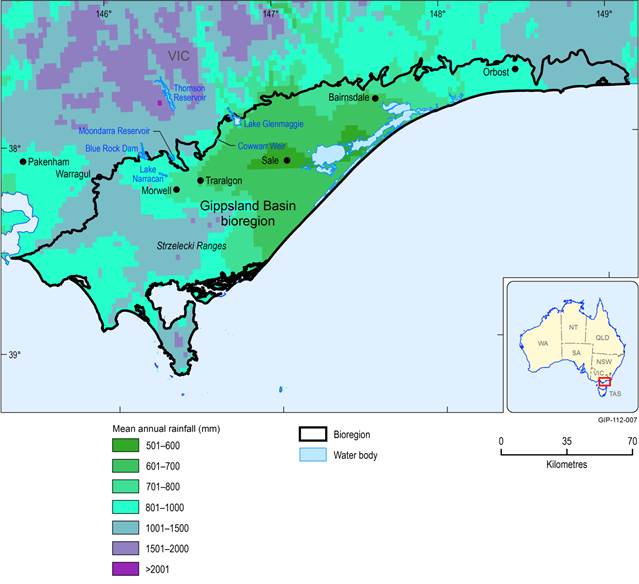
Figure 12 Mean annual rainfall across the Gippsland Basin bioregion
Data: Bureau of Meteorology (Dataset 11)
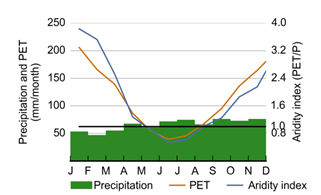
Rainfall levels combined with the potential evapotranspiration (PET) largely determine the relative moisture availability of an area. Across the Gippsland Basin bioregion PET is generally higher on the elevated peaks, and the eastern part of the bioregion. When combined with rainfall into an aridity index (Figure 13) it can be seen that the driest areas are the Gippsland plains from Morwell to Bairnsdale, with relatively greater moisture available on, and to the west of the Strzelecki Ranges, as well as the eastern region surrounding Orbost. Over the year, PET is highest during summer, reaching over 200 mm/month, and lowest during winter, dropping to less than 50 mm/month (Figure 11). Due to relatively stable precipitation, the annual aridity follows a similar trend.
Data: CSIRO Land and Water (Dataset 10)
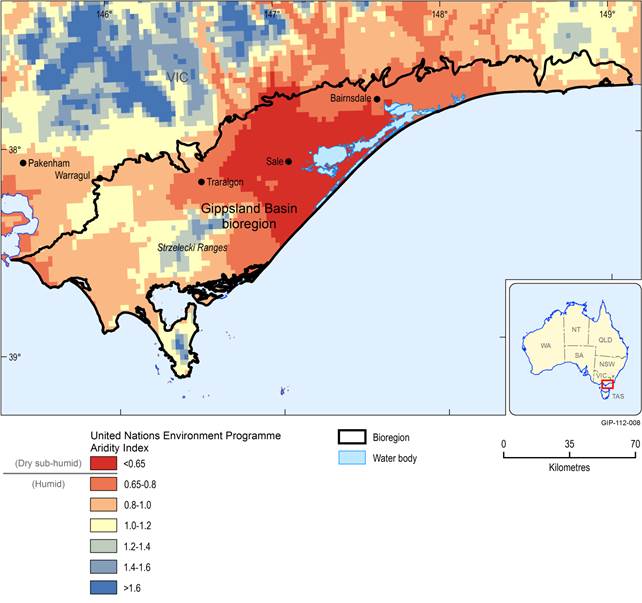
Figure 14 Aridity Index values across the Gippsland Basin bioregion
Data: Bureau of Meteorology (Dataset 12)
1.1.2.3.2 Temperature
Altitude and proximity to the coast are the main drivers of temperature across the bioregion. The region experiences summers with mean maximum temperatures around 24 °C and mean minimums of around 13 °C. Winter temperatures range from 5 to 14 °C. The hottest temperatures are generally experienced in the area surrounding Sale, and the coolest in the Strzelecki Ranges. The Gippsland plains are comparatively hotter due to descending winds from the Victorian Alps (Joint Commonwealth and Victorian Regional Forest Agreement Streering Committee, 1999). Figure 15 shows the range of minimum and maximum temperatures by month.
For a description of this figure, please contact bioregionalassessments@bom.gov.au.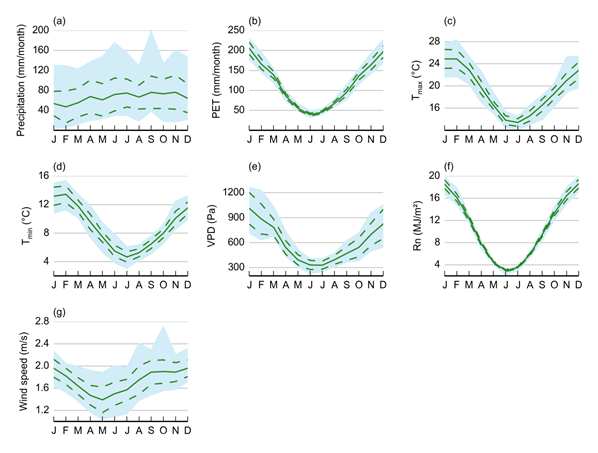
Data: CSIRO Land and Water (Dataset 10)
Data: CSIRO Land and Water (Dataset 10)
1.1.2.3.3 Future climate projections
Table 10 and Table 11 present the projected climate outcomes for the catchments in the region for 1 and 2 degrees of warming, combined with either a dry extreme, median or wet extreme scenario (Post DA, 2012). These outcomes were determined through the South Eastern Australian Climate Initiative (SEACI) study which performed modelling analysis on 15 global climate models (GCMs) and daily rainfall and areal potential evapotranspiration statistics from 1895 to 2008. In all warming scenarios it is predicted that the annual rainfall and runoff will reduce compared to the historical mean. The exceptions are the Snowy River and Tambo River catchments which under the wet extreme scenario either have a small increase in rainfall and runoff, or stay consistent with current levels. As expected, the climate scenario of 2 degrees of warming produces a greater reduction, with worst-case predictions of up to a 17% reduction in rainfall and 41% reduction in runoff occurring for the Tambo river basin under a dry extreme scenario. Although there is inherent uncertainty in the projected outcomes, for all catchments the majority of GCMs project a decrease in future rainfall and runoff under both a 1 and 2 degrees of warming.
The reliance of the Gippsland Region economy on natural resources makes the area potentially more susceptible to negative consequences from climate change. In particular a reduction in rainfall is cited as the greatest climate threat to the region (Gippsland Regional Plan Project Control Group, 2010).
Table 10 Predicted degree of change to rainfall for the catchments in the Gippsland Basin bioregion under two global warming scenarios
Data: Post et al. (2012)
Table 11 Predicted degree of change to runoff for the catchments in the Gippsland Basin bioregion under two global warming scenarios
Data: Post et al. (2012)
