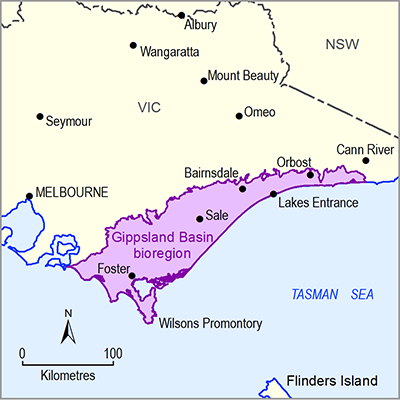
The Department of Environment and Primary Industries (DEPI) of the Victorian Government monitors and reports the water quality across Victoria's water resources including the river basins that are part of Gippsland Basin bioregion through a number of programmes and partnerships. The Water Measurement Information System (Department of Environment and Primary Industries, 2015) is the primary access point to search, discover, access and download water quality data collected by DEPI and its partners. Waterwatch Victoria (Waterwatch Victoria, 2015) is one of the DEPI’s partner organisations and monitors water quality and river health through a community engagement programme connecting local communities with river health and sustainable water issues and management. The water quality indicators included in this report are EC and turbidity and results are based on variable data periods for different river basins.
Water quality indicators for the rivers in the Gippsland Basin bioregion were evaluated against the water quality objective trigger value provided by the Environment Protection Authority (EPA) of the Victorian Government. In general EC levels are low and stable across the bioregion but subject to occasional high pulses at some gauging sites. Turbidity is high and subject to varying trends as a result of local influences. It appears turbidity decreases from upstream to downstream of the catchments. The 75th percentile water quality objective value for EC for most of the Gippsland Basin bioregion is 500 µS/cm while for the forested parts in the upper catchments it is 100 µS/cm. The water quality objective value for turbidity is 5 NTU for the East Gippsland River Region and it is 10 NTU for the rest of the Gippsland Basin bioregion (EPA, 2003). It is mentioned here that the surface water and groundwater of Victoria are currently being reviewed and this may change the current water quality objectives.
Both EC and turbidity are very high in parts of the South Gippsland River Region compared to other river regions in the Gippsland Basin bioregion. Department of Environment and Primary Industries (2013b) shows that EC values at Meeniyan on the Tarwin River are close to 500 µS/cm and there is an increasing trend since 2005. Turbidity values are also much higher compared to the trigger value, reaching up to 92 NTU. However, not all watercourses exceed trigger values in this river region. For example, the mean and median EC values at Tarraville on the Tarra River are 255 and 245 µS/cm, respectively. Turbidity for this station varies between 0.9 and 24.7 NTU with mean and median of 6.0 and 4.6 NTU, respectively.
Across the Mitchell–Thomson River Region, both EC and turbidity vary greatly between watercourses. At Glenaladale on the Mitchell River the EC varies between 40 and 150 µS/cm with mean and median of 78 and 74 µS/cm, respectively. Turbidity at the same site varies between 0.7 and 5.4 NTU with mean and median of 2.1 and 1.8 NTU, respectively. The mean and median EC values for the Thomson River at Bundalaguah are 118 and 120 µS/cm, which are relatively high compared to those found in the Mitchell River. However, these values are still much smaller than the trigger value. The turbidity for the Thomson River is very high with mean and median of 27.3 and 18 NTU, respectively. Water quality of these river systems is particularly important as they discharge catchment runoff to the Gippsland Lakes which is listed as a Ramsar Site.
Water quality for major watercourses in the Snowy River Region is generally good. An analysis based on observed data at Orbost station on the Snowy River for the period of 1991 to 1998 (95 readings) shows that EC varies between 56 and 556 µS/cm with mean and median of 160 and 145 µS/cm, respectively. The mean and median turbidity for the same site (95 data) are 5.4 and 2.5 NTU, respectively.
Water quality indicators for all major watercourses in the East Gippsland River Region are relatively good. The EC values in this river region are generally much lower than the water quality objective trigger value of 500 µS/cm. An analysis based on observed data at Princes Highway on the Bemm River (GS 221212) for the period of 1991 to 2013 (292 readings) shows that EC values are in the range of 18 to 320 µS/cm (mean: 79, median: 76) which is much less than the trigger value. Turbidity for the same site (268 data) varies between 0.4 and 73.0 NTU with mean and median of 5.5 and 3.2 NTU, respectively.
There have been three studies that have analysed long-term trends in river water quality across Victoria. The first water quality trend report was published in 1998 and the second in 2007. The Victorian Water Quality Trends 1991–2010 is the third long-term assessment of trends in water quality and focuses specifically on changes in water quality before and after 2005. Water quality is strongly influenced by local conditions and events, such as rainfall, runoff, floods and bushfires. As a result, water quality is inherently variable but is only of concern when results are consistently outside the expected natural variability. Department of Environment and Primary Industries (2013b) shows EC generally increased across the Gippsland Basin bioregion after June 2005 but the increases are relatively small. Turbidity has also increased after June 2005, but the increases at most sites are not likely to be environmentally significant. Individual instances of high turbidity were recorded at sites in several Gippsland rivers during or soon after large floods (Department of Environment and Primary Industries, 2013b).

