In this section, groundwater quality is reported in terms of salinity (mg/L total dissolved solids (TDS)), drawing on readily available information. The Victorian Government (Department of Environment and Primary Industries) has produced groundwater salinity maps for each of the aquifer layers within the VAF (e.g. Sinclair Knight Merz, 2014). These salinity maps reflect all salinity data available through time, rather than a time slice of salinity distribution (Sinclair Knight Merz, 2014). The most recent update of these maps is presented in Section 1.1. 4.2.1 for each of the aquifer systems of the Gippsland Basin and the Moe Swamp and Tarwin sub-basins.
There is limited published research about the hydrogeochemistry of the Gippsland Basin for understanding groundwater flow patterns and inter-aquifer mixing. A recent study by Hofmann and Cartwright (2013) is one of the most comprehensive studies investigating the use of hydrogeochemistry for understanding aquifer systems in the Gippsland Basin. This study focused on the groundwater systems of the Latrobe Valley and Lake Wellington depressions. The major findings of the study were: major ion chemistry of groundwater in all aquifers is similar across the basin, with no systematic changes along flow paths; localised preferential flow paths, as well as regional hydraulic gradients, influence the chemistry of the groundwater; and relatively indistinct groundwater chemistry between the different aquifers of the Gippsland Basin within the Latrobe Valley and Lake Wellington depressions indicates that inter-aquifer mixing and leakage may be significant. Hofmann and Cartwright (2013) noted that the extent to which groundwater extraction has influenced the degree of inter-aquifer mixing is not known as there is no historical geochemical data available to undertake such an investigation. Groundwater flow systems will be discussed in further detail in Section 1.1 .4.3.
1.1.4.2.1 Spatial variability of groundwater quality
Figure 23 presents maps of groundwater salinity in the Gippsland Basin.
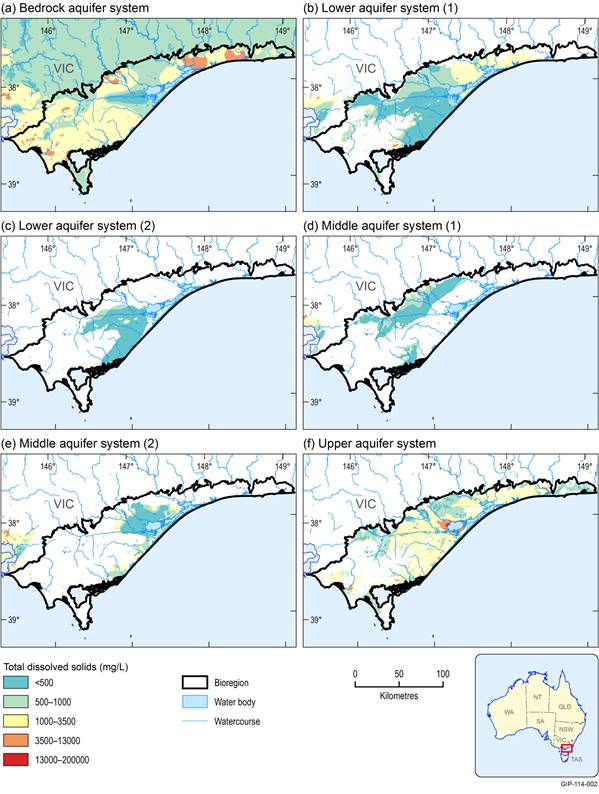
Figure 23 Groundwater salinity (total dissolved solids (mg/L)) in the Gippsland Basin bioregion
Figure (a) is salinity of the Strzelecki Group and Paleozoic fractured rock aquifer; Figure (b) is salinity of the lower Tertiary aquifer and the lower Tertiary aquifer (basalt) grouped together here as Lower aquifer system (1); Figure (c) is the lower middle Tertiary aquifer, referred to here as Lower aquifer system (2); Figure (d) is the upper middle Tertiary aquifer, referred to here as middle aquifer system (1); Figure (e) is the upper Tertiary (fluvial) aquifer, referred to here as Middle aquifer system (2); and Figure (f) is the Quaternary and upper Tertiary aquifer
Data: Victoria Department of Environment and Primary Industries (Dataset 1)
The salinity data presented is from the Victorian Aquifer Framework project and as such, is presented in a manner consistent with the Victorian Aquifer Framework.
Bedrock aquifer system (Cretaceous and Ordovician to Carboniferous): Strzelecki Group and Paleozoic basement sediments and intrusives
The data coverage in the bedrock aquifer is very poor and so there is low confidence in the distribution of groundwater salinity within the bedrock fractured rock aquifer presented in Figure 23 (a). In general, the picture is one of low salinity groundwater (<500 mg/L) in the vicinity of the Baragwanath Anticline and areas of higher salinity groundwater (3500 to 13,000 mg/L TDS) throughout the remainder of the bedrock aquifer, particularly in the region of Heyfield, Metung – Lakes Entrance, Orbost and Marlo. The Paleozoic fractured rock aquifers appear to have lower salinity than the Strzelecki Group fractured rock aquifers.
Lower aquifer system (Eocene to Oligocene): Latrobe Group, basal coal units of the Morwell Formation sediments and volcanics
Groundwater salinity in the lower aquifer system (Figure 23 (b)) is generally below 3500 mg/L TDS. Salinity generally increases towards the east. Groundwater of the lower aquifer system has particularly low salinity in the western part of the Gippsland Basin and in the Moe Swamp sub-basin, with salinity generally less than 1000 mg/L TDS. Patches of elevated salinity are also evident along the edge of the Strzelecki Range and on the crest of the Baragwanath Anticline. The overlying aquifers also have elevated salinity in these areas.
In the Tarwin sub-basin (Figure 23 (c)), groundwater salinity in the Childers Formation/Thorpdale Volcanics Aquifer ranges from 200 to 2000 mg/L TDS, and tends to decrease at greater aquifer depths (Nicol, 2010). In the Moe Swamp sub-basin, groundwater salinity varies from less than 500 to 1000 mg/L TDS.
Middle aquifer system (Oligocene to Miocene): Latrobe Valley Group and Seaspray Group sediments
The uppermost part of the middle aquifer system (Figure 23 (d)), the Boisdale Formation (Wurruk Sand Member) is an important aquifer within the Gippsland Basin due to its high pumping yields and generally low salinity. The groundwater salinity is generally less than 500 mg/L TDS, however higher salinity groundwater (500 to 3500 mg/L TDS) is evident in the region between Rosedale and Maffra in the north; in the eastern part of the aquifer, towards Lakes Entrance; and in the south-west and south along the coast.
Groundwater of the Balook Formation, Morwell Formation, Yarragon Formation and Alberton Coal Measures aquifers is of good quality, generally having salinity of less than 500 to 1000 mg/L TDS. Higher salinities are evident along the bedrock boundaries in the north (up to 3500 mg/L TDS), along the crest of the Baragwanath Anticline (up to 13,000 mg/L TDS) and north and south of the Strzelecki Range (Figure 23 (e)). A similar pattern of elevated salinities in the lower aquifer is also evident in these areas.
Upper aquifer system (Pleistocene to Holocene): Sale Group sediments and recent Quaternary
Low salinity groundwater (<1000 mg/L) is found in the aquifers of the recent Quaternary and Sale Group sediments in the Lake Wellington catchment and Mitchell River valley as well as around the regions of Moe and Orbost, the South Gippsland Coast and in the upper valleys of the Macalister, Mitchell, Tambo and Snowy rivers (Southern Rural Water, 2012). Groundwater within the surficial aquifers across the remainder of the Gippsland Basin bioregion is generally of poorer quality (>1000 mg/L). High salinity groundwater (mainly within the class 3500 to 13,000 mg/L TDS) exists in the vicinity of Lake Wellington and within the Macalister Irrigation District, as well as some areas along the coast.
Hofmann and Cartwright (2013) interpreted hydrogeochemical data to indicate that higher salinity groundwater in younger units in the Gippsland Basin is likely the result of significant evapo-concentration of shallow groundwater.
About 110 km2 of Gippsland’s farmland is affected by irrigation-induced salinity and about 130 km2 is affected by dryland salinity (DSE, 2011). Salinisation in Gippsland has been caused by land clearing and inefficient irrigation which leads to an elevated watertable. Salinity has been an issue for the Macalister Irrigation District as well as low-lying areas with naturally high watertables near the coast and the Gippsland Lakes. Within the Macalister Irrigation District, salinity is actively managed by pumping from public and private groundwater bores and improving surface drainage to lower the watertable (DSE, 2011). A network of 260 observation bores across the Lake Wellington catchment is managed by the West Gippsland Catchment Management Authority. Quarterly groundwater level monitoring of selected bores within this network is undertaken to ensure that salinity interception pumps are managed optimally. A depth to watertable map is produced annually from this data.
Additionally, DSE (2011) reported that there is potential for seawater intrusion in the Clydebank area near Lake Wellington and the Yarram area in South Gippsland. DSE (2011) reported that in these areas, restrictions on groundwater extraction and pumping rates have been implemented to manage seawater intrusion risk.
1.1.4.2.2 Temporal variability of groundwater quality
Aside from shallow groundwater salinity in the irrigation districts of the Gippsland Basin, there are no readily available studies investigating the temporal variability of groundwater quality or temporal trends in groundwater quality in the Gippsland Basin. The groundwater systems of the Gippsland Basin are not in steady state and there have been significant changes to land use and surface and groundwater hydrology in the past four decades. It is therefore likely that there have been changes to the distribution of groundwater quality over time, however, time series groundwater quality monitoring data does not appear to be available to investigate the distribution and magnitude of these changes across the Gippsland Basin. There are approximately 300 bores in the Gippsland Basin bioregion with greater than 15 salinity measurements recorded in the Victorian Groundwater Management System (GMS). These bores are principally located within the macalister irrigation district and of the 300 bores, 294 are less than 50 m deep. The majority of time-series salinity data was collected in the decades 1980-1990, 1990-2000 and 2000-2010.
