1.1.2.2.1 Population
The overall population of the Gippsland Basin bioregion has been estimated at 203,445 based on the population counts of the 2011 Australian Bureau of Statistics (ABS) census mesh blocks which fall within the Assessment area (Australian Bureau of Statistics, 2011a; 2011b). Using the same method, the number of houses in the bioregion is estimated at 101,903. There are six Victorian local government areas (LGAs) present in the Gippsland Basin bioregion, although none are fully included in the area of the bioregion. Approximately 90% of Latrobe, 90% of South Gippsland, 50% of Bass Coast, 50% of Wellington, 30% of Baw Baw, and 20% of East Gippsland LGAs intersect the Gippsland Basin bioregion (Australian Bureau of Statistics, 2011b). The ABS statistical areas level 3 (SA3) broadly align with the Victorian LGAs, although Bass Coast and South Gippsland LGAs are combined in the SA3. Figure 9 shows the LGA boundaries as well as the population density of the Gippsland Basin bioregion based on the 2011 census mesh block counts.
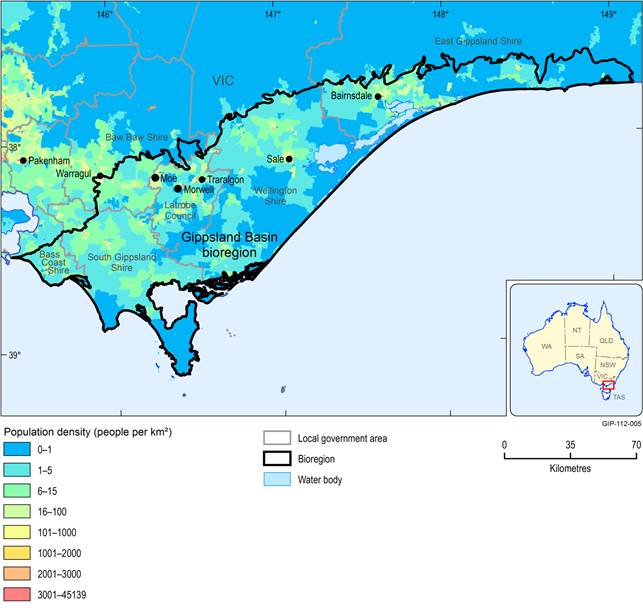
Figure 9 Population density of the Gippsland Basin bioregion
Data: ABS (Dataset 5)
The population is dispersed throughout the region, with over 40% of the population residing in towns with less than 1000 people (Gippsland Regional Plan Project Control Group, 2010). Although there are no major cities falling within the Assessment area, there are six population centres in the bioregion which had a population of over 10,000 in 2011. These include Traralgon (24,590), Moe (13,691), Morwell (13,691), Warragul (13,081), Sale (12,766), and Bairnsdale (11,820) (Australian Bureau of Statistics, 2001 & 2011). Most of these larger towns are situated along the main access road, the Princes Highway. Across the bioregion there are an additional 48 small towns ranging in population from around 200 to 7279 including: Lakes Entrance, Wonthaggi, Leongatha and Maffra. Table 6 presents the 2001 and 2011 census population of the main town centres of the Gippsland Basin bioregion, and the population change between years.
Table 6 Main population centres of the Gippsland Basin bioregion and their population change from 2001 to 2011
Data: ABS (2001, 2011)
aAustralian Bureau of Statistics
Unlike other rural areas of Australia, the rural population of Gippsland is not in decline (Gippsland Regional Plan Project Control Group, 2010). Since 1996 the population has increased by approximately 30,000 residents (Joint Commonwealth and Victorian Regional Forest Agreement Streering Committee, 1999). Currently the Baw Baw and Bass Coast LGAs are among the fastest growing in Victoria (Gippsland Regional Plan Project Control Group, 2010) and substantial population increases are predicted for the South Gippsland LGA population (Strategic Planning and Development Department, 2014). The overall population of the Gippsland region is predicted to increase by approximately 50,000 (20%) by 2026, with a large increase in the number of people over 65 years of age (Gippsland Regional Plan Project Control Group, 2010). This value has been calculated for a wider extent than the bioregion, but it does suggest that the bioregion is likely to experience significant population growth. Table 7 shows the population growth between 2011 and 2012 for the local government areas represented in the bioregion. Overall the population growth is greater in the western parts of the bioregion compared to the east. This is due to the expansion of the outer suburbs of Melbourne.
Table 7 Population growth by local government area between 2011 and 2012 for the Gippsland Basin bioregion
Data: ABS (Dataset 6)
aAustralian Bureau of Statistics, bstatistical areas level 3
1.1.2.2.2 Economic activity
The economy of Gippsland is primarily based on agriculture, forestry, dairy and mining with a gross regional product estimated at $13.26 billion. This equates to approximately 5% of Victorian Gross Domestic Product (GDP) (Gippsland Regional Plan Project Control Group, 2010). Despite over 30% of businesses in the area being related to the agriculture and fishing industries, the key economic industries are electricity generation, oil and gas production, manufacturing and water supply (Gippsland Regional Plan Project Control Group, 2010).
Approximately 90% of Victorian power is generated from three power stations within the bioregion at Yallourn, Hazelwood and Loy Yang, with coal sourced from the Latrobe Valley. Mining of brown coal began in the Gippsland Basin bioregion in 1826 (Morgan, 1997), with extensive mining of the Latrobe Valley coal resources beginning in the 1920s (Joint Commonwealth and Victorian Regional Forest Agreement Streering Committee, 1999). It is estimated that 430 Bt of brown coal remain in situ in the Latrobe Valley, with 33 Bt of economic resource (Gippsland Regional Plan Project Control Group, 2010). In addition, conventional oil and gas from the Gippsland Basin contributes approximately 20% of Australias production (Gippsland Regional Plan Project Control Group, 2010).
The Gippsland region contributes over 20% of national milk production (GippsDairy, 2013). Dairy farming and manufacturing of dairy products is the largest employer in the South Gippsland region. The Macalister Irrigation District is a key dairy, agriculture and forestry area and covers approximately 530 km2 between Sale and Lake Glenmaggie following the Macalister and Thomson river valleys (Southern Rural Water, 2014).
Forestry has been a key economic element of the region since the 1840’s. The Strzelecki Ranges were initially cleared of native vegetation by 1900 and have since been used for forestry (Joint Commonwealth and Victorian Regional Forest Agreement Streering Committee, 1999).
South Gippsland attracts approximately a million visitors annually, with a focus on natural environments such as Wilsons Promontory and the Gippsland Lakes (Strategic Planning and Development Department, 2014). The total annual output from tourism in the region was estimated at $837.4 million in 2010 (Gippsland Regional Plan Project Control Group, 2010). A key strategy of the Gippsland Regional Plan is to better manage the Gippsland Lakes tourism region to better cope with high tourist number and growing population (Gippsland Regional Plan Project Control Group, 2010).
From 2006 to 2010 the number of jobs rose by around 6000 (Gippsland Regional Plan Project Control Group, 2010). Due to the relatively high numbers of retirees, the region has one of the lowest employment participation rates in Victoria (Gippsland Regional Plan Project Control Group, 2010).
1.1.2.2.3 Land use
The land use of the Gippsland Basin bioregion closely relates to the economic activities in the region (Table 8, Figure 10), with the majority of land used for production from dryland agriculture and plantations (Australian Bureau of Agricultural and Resource Economics and Sciences, 2014). Conservation and natural environments is the second largest land use with 17% of the bioregion, much of it public land, used for conservation and preservation of the natural environment. Many of these areas are important for tourism including the Gippsland Lakes and Corner Inlet, Wilsons Promontory, Walhalla (Australian Alps Walking Track) and the Strzelecki Ranges.
Table 8 Area and percentage of the Gippsland Basin bioregion covered by land use category
Data: Geoscience Australia (Dataset 7)
Land use in the Strzelecki Ranges is primarily for softwood forestry. The Ranges were initially cleared of native vegetation by 1900 and have since been used for forestry (Joint Commonwealth and Victorian Regional Forest Agreement Streering Committee, 1999). Although some areas are protected in nature reserves (Tarra-Bulga National Park, Morwell National Park, Mount Worth State Park). Two Regional Forest Agreements (RFA) cover large segments of the Assessment area - the Gippsland RFA and the East Gippsland RFA – and govern the land use and forestry practices allowable.
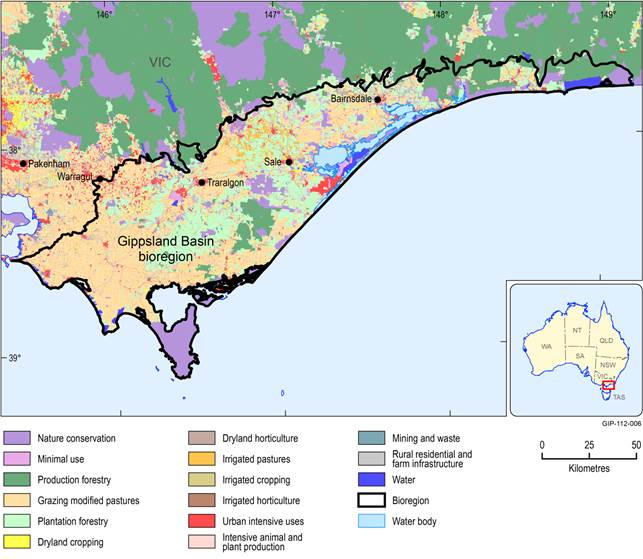
Figure 10 Land use of the Gippsland Basin bioregion
Data: Geoscience Australia (Dataset 8)
1.1.2.2.4 Water storage
There is 60% of Melbourne’s water sourced from catchments in the Gippsland region (Gippsland Regional Plan Project Control Group, 2010). In addition the majority of the industries present in the bioregion are reliant on water supply. Southern Rural Water is responsible for water supply management across the region, and maintain four major water storage locations in the Gippsland Basin bioregion: Lake Glenmaggie, Cowwarr Weir, Blue Rock Dam and Lake Narracan (Southern Rural Water, 2014). Gippsland Water maintains the Moondarra Reservoir, and Melbourne Water maintains numerous water storages north of the bioregion including the Thomson Reservoir which is the largest water storage in Melbourne’s water supply, providing the majority of Melbourne’s water (Melbourne Water, 2014). Table 9 lists the storage capacity, catchment area and discharge capacity of each. The locations of the major storages are shown in Figure 12.
Table 9 Water storages of the Gippsland Basin bioregion
Data: Melbourne Water (2014), Southern Rural Water (2014)
Lake Glenmaggie provides water to the Macalister Irrigation District through three main irrigation channels: Main Northern (capacity 500 ML/day), the Main Southern (capacity 1460 ML/day) and the Main Eastern (capacity 600 ML/day) (Southern Rural Water, 2014). The Macalister Irrigation District 2030 Plan describes the management of the 600 km of irrigation channels (Gippsland Regional Plan Project Control Group, 2010).
In 2012 the Victorian Desalination Plant was developed near Wonthaggi in order to supplement the standard catchment water supply during periods of low rainfall. The plant has a production capacity of 150 GL/year (Aquasure, 2014). In addition, the Gippsland Water Factory at Maryvale processes wastewater from over 19,000 properties and the Maryvale Paper Mill producing water for industrial use (Gippsland Regional Plan Project Control Group, 2010).
1.1.2.2.5 Indigenous heritage
The Kurnai Indigenous nation (now known as Gunnai) covered what is now the Gippsland region before European settlement. By 1850 the native population had been severely reduced due to disease, massacres and declining birth rates (Morgan, 1997).
Indigenous land use agreements are present over much of the region. The Gunaikurnai Settlement Indigenous Land Use Agreement (ILUA) covers approximately 13,390 km2 within the Gippsland Basin bioregion, between the coast and the Great Dividing Range from Moe to the Snowy River. The agreement has been in effect since 2010 and was the first to be formalised under the new Victorian native title settlement framework (Bourova, 2011).
