1.1.5.3.1 Finke catchment
As previously mentioned, there is no dedicated monitoring of the lower Finke and Finke Floodout at this time, though Williams (1970) mentions that the 1967 floods were gauged at Finke Community without providing any quantitative information. The NT Government (A Duguid, pers. comm., 2013) has confirmed that there was a gauge in operation between 1960 and 1978 at Finke Community, likely by the old Ghan railway line, and can confirm that at least three flood events occurred during this time. It cannot be stated with any confidence that this is the definitive list of flood events during that time, nor is there any quantitative information regarding those flow events.
It has been suggested that the floodout will receive some water around one in five years (Love et al., 2013), though large flows originating in the upper Finke catchment that completely inundate the floodout have been suggested as occurring around once a decade or less (Duguid, 2013). There are no data to confirm this suggestion. Flows large enough to reach the floodout are of importance for recharge of the Great Artesian Basin aquifers as a key recharge area has been located upstream of the floodout, near Finke Community (Love et al., 2013).
Key flood events recorded in the upper reaches of the Finke catchment that at least partially inundated the Finke Floodout are known for 2010, 2000, (possibly) 1988, 1974, 1972, 1967, and (likely) 1921.
Contrasting the 2000 and 2010 floods, water was known to persist in the floodout for nearly three years following the 2000 event (Duguid, 2005) whereas the wetting caused by the 2010 flood dried out much more quickly. This could be due to more small and/or local flow events in the years following the 2000 flood than the 2010 flood. These flows tend not to be of sufficient magnitude to inundate the floodout without prior establishment of hydraulic connectivity by the larger, main channel floods. However, when connected, they enable the wetlands to persist far longer than would otherwise be the case (A Duguid, pers. comm., 2013) and therefore could be of great ecological significance. At this time, no data have been collected to confirm these observations and much of the initial flooding has been unobserved. Currently, work is being undertaken to improve monitoring of the floodout and better liaise with local pastoralists.
1.1.5.3.2 Macumba catchment
There is very little information regarding flow events in the Macumba catchment. The best documented flow event was the 1967 flood, detailed by Williams (1970). Caused by the southward intrusion of monsoonal storms, that event was enough to cause inundation of several kilometres of floodplain, the flooding of Stevenson Creek shown in Figure 32. Stage heights were estimated at between 5 to 7 m in Stevenson and Hamilton Creeks and Alberga River (Williams, 1970). The Macumba Floodout was extensive and is shown in Figure 33. No information is provided as to how long the floodwaters persisted. Similarly to the Neales-Peake catchment, described in Section 1.1.5 of the companion product 1.1 for the Arckaringa subregion (Miles et al., 2015), subcatchment and local flows in response to the more localised thunderstorm-derived rainfall are more common than whole-of-catchment events. These lower flow events are of critical importance to local biota, though no information exists at this time to describe the mechanics of the long term flow cycle in the catchment.
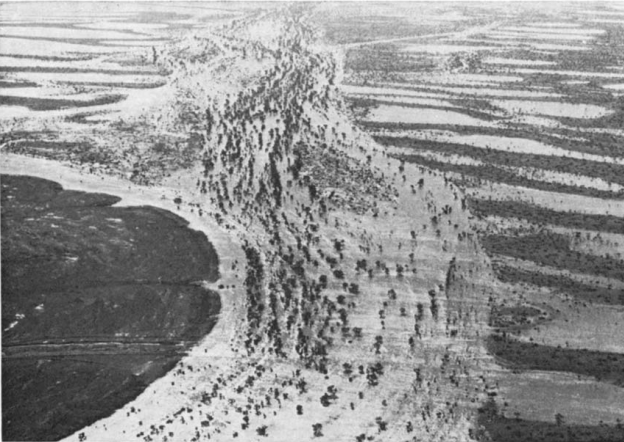
Figure 32 Flood of Stevenson Creek in 1967
Source: Williams (1970). This figure is not covered by a Creative Commons Attribution licence. It has been reproduced with permission from Elsevier.
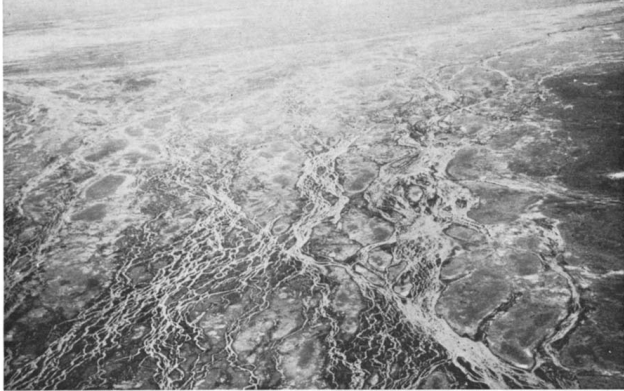
Figure 33 Macumba Floodout during the 1967 floods
Source: Williams (1970). This figure is not covered by a Creative Commons Attribution licence. It has been reproduced with permission from Elsevier.
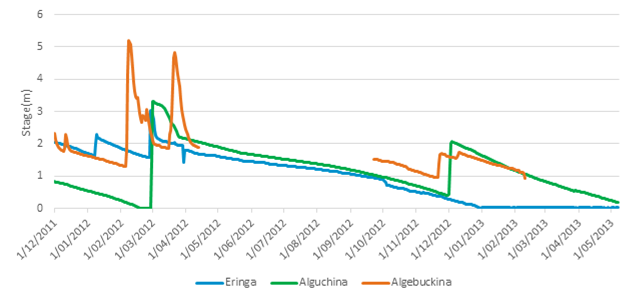
At this time, the hydrological data collected in the catchment consists of stage and water quality data at both Eringa Waterhole on the Lindsay River, a tributary of the upper Stevenson, and at the Macumba River near Alguchina Waterhole towards the downstream end of the catchment for the period December 2011 to present. Figure 34 demonstrates that in this period two flow events were captured at both sites, with the March 2012 flow observed at both locations indicating a subcatchment flow. The other flow events were local flow events, with the local event of December 2012 observed at Alguchina and Algebuckina Waterhole in the Neales-Peake catchment (see Section 1.5.1 of the companion product 1.1 for the Arckaringa subregion (Miles et al., 2015)). Alguchina Waterhole is 30 km closer to Algebuckina than to Eringa, and the fact that a flow event that was observed in Eringa was not seen Alguchina and a flow event large enough to register in both Alguchina and Algebuckina but not Eringa highlights the local nature of rainfall events and the difficulties inherent in modelling the catchment response thereof.
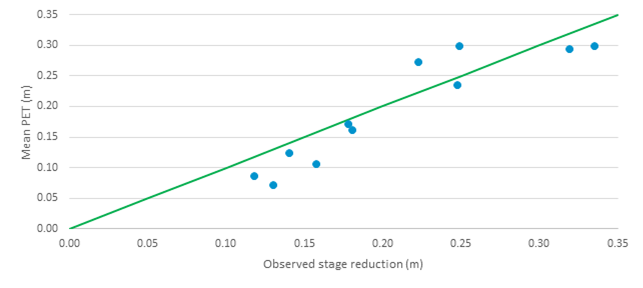
The nature of these flow events suggests that the Macumba catchment behaves similarly to the Neales-Peake, where flow events can be expected most years. Analysis of the Eringa stage data (Figure 34) indicates observed losses are approximately equal to those that would be expected from evaporation of a closed (i.e. non-leaky) waterbody. No information regarding the frequency of the Macumba River flooding into Warburton Creek is available.