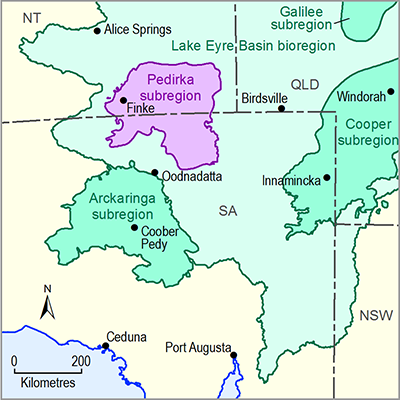
1.1.5.2.1 Finke catchment
Extremely limited water quality data exists for the lower Finke and Finke Floodout. Observational evidence of one waterhole on Lilla Creek, Paddy’s Well, indicates that it is fresh, though no measurements of conductivity were taken (A Duguid, pers. comm., 2013).
1.1.5.2.2 Macumba catchment
As mentioned previously, less than one and one-half years of water quality data for the Macumba catchment exists at two locations in the catchment. The most complete data are that collected at Eringa Waterhole on Lindsay River. Figure 31 indicates that the waterhole is predominately fresh, except when flushed with saline inflow from a flood event. During the flood event of March 2012, the initial floodwaters dropped conductivity from 170 to 105 µs/cm before rising to a maximum value of 1597 µs/cm one week after peak stage and receding to 145 µs/cm 32 days after peak salinity. It can be seen from Figure 31, that the small local flow in January 2012 was not significant enough to affect conductivity.
Figure 31 Stage and conductivity for Eringa Waterhole, December 2011 - May 2013

Product Finalisation date
- 1.1.1 Bioregion
- 1.1.2 Geography
- 1.1.3 Geology
- 1.1.4 Hydrogeology and groundwater quality
- 1.1.5 Surface water hydrology and surface water quality
- 1.1.6 Surface water – groundwater interactions
- 1.1.7 Ecology
- Citation
- Acknowledgements
- Contributors from the Government of South Australia
- Contributors to the Technical Programme
- About this technical product

