3.4.5.1 Description
Most streams in the zone of potential hydrological change are not groundwater dependent (3484 km or 55% of streams in the zone) (Table 19). The ‘Streams, non-GDE’ landscape group includes four landscape classes that are classified based on water regime (near-permanent or temporary) and landscape position (lowland or upland). Most streams in the zone of potential hydrological change have a temporary water regime. The ‘Temporary, lowland stream’ landscape class includes 3114 km of streams and ‘Temporary, upland stream’ landscape class includes 365 km of streams. The zone also includes 5 km of streams with a near-permanent water regime, including 4 km classified as ‘Near-permanent, lowland stream’ and 1 km classified as ‘Near-permanent, upland streams’.
Dry seasonal flows in the Belyando river basin mean that the ‘Streams, non-GDE’ landscape group is characterised by a ‘boom–bust’ ecology (Figure 44). Specifically, diversity is maintained by natural cycles of river flow and drying, driven by surface water inputs (Sternberg et al., 2015). While the more arid rivers further west in the Galilee subregion are driven by highly unpredictable rainfall, the ‘boom–bust’ cycle in the Belyando river basin is relatively predictable and follows an annual hydrological cycle (Blanchette and Pearson, 2012, 2013). Ecological processes within the zone operate in an environmental context where there is seasonally predictable summer rainfall, which produces a resource pulse that is followed by a predictable period of drying. The drying phase is a relatively constant process that is, in an average year, uninterrupted by rainfall falling outside the summer period (Blanchette and Pearson, 2013).
During the months of high rainfall (generally between December and April), the dry rivers begin to flow and seasonally isolated water-dependent habitats (e.g. waterholes) are connected. This annual period of in-channel flow, or flow pulses, may be associated with large floods producing overbank flow (see below) or it may occur independently in response to localised rainfall (Sheldon et al., 2010). Flooding occurs at unpredictable intervals in response to periods of very high rainfall (i.e. it is not an annual occurrence). During these high rainfall periods, there is overbank flow and the environment becomes a large network of interconnected river channel and floodplain habitat. Overbank flooding is used to identify the ‘boom’ phase in Australia’s dryland rivers (e.g. Sheldon et al., 2010).
During the ‘boom’ phase, aquatic and terrestrial productivity is high. Dispersal of freshwater fauna occurs during this phase and important life-history stages are completed. A significant part of the aquatic fauna in this system is capable of long-distance dispersal, with animals recolonising areas from distant waterholes once movement pathways are opened by flooding. Fish are prime examples of such a group (e.g. Kerezsy et al., 2013). At the end of the wet phase, all of the waterholes are likely to be replenished and be at their most productive.
Thus the ‘Streams, non-GDE’ landscape group of the zone of potential hydrological change experiences annual in-channel flows each summer and flood events at irregular intervals. The in‑channel flows are important for maintaining connectivity and dispersal of aquatic organisms; however, they do not feature the high primary productivity of the flood events (Sheldon et al., 2010).
During the months of low or no rainfall (generally May to November) drying of the drainage system produces a series of waterholes and running reaches that have variable connectivity (Pusey and Arthington, 1996). Where the drying results in cease-to-flow events, shallow waterbodies dry out and a chain of pools, isolated pools or completely dry riverbeds result, depending on riverbed morphology. As conditions continue to dry, evaporation will reduce the depth of each waterhole. Over time, productivity will change and the physico-chemical conditions decline. Changes occur in dissolved oxygen, conductivity and pH (Blanchette and Pearson, 2013).
Waterholes during low-flow or no-flow periods tend to be characterised by high turbidity and limited light penetration. The aquatic food webs of these waterholes are typically driven by energy inputs from filamentous algae that form as a highly productive band in the shallow littoral margins. Phytoplankton blooms and zooplankton may also be important parts of the aquatic food web during the ‘bust’ phase. The algae, phytoplankton and zooplankton support large populations of snails, crustaceans and fish (Bunn et al., 2003).
3.4.5.2 Potential hydrological impacts
Potential ecosystem impacts on streams classified as ‘Streams, non-GDE’ landscape group are assessed using the ‘High-flow macroinvertebrate’ receptor impact model based on predicted mayfly nymph (Offadens sp.) densities. Changes to groundwater depth are unlikely to affect these non-groundwater dependent streams.
For the ‘High-flow macroinvertebrate’ receptor impact model, the relevant hydrological response variables are:
- number of days per year with low flow (<10 ML/day), averaged over a 30-year period LQD)
- maximum length of spells (in days per year) with low flow, averaged over a 30-year period (LME), using a modelled 10 ML/day threshold to represent an ecological flow threshold of 1 ML/day used during the expert elicitation.
3.4.5.2.1 Groundwater
The ‘Streams, non-GDE’ landscape group is not considered to be groundwater dependent.
3.4.5.2.2 Surface water
Most streams in the ‘Streams, non-GDE’ landscape group in the zone of potential hydrological change have a temporary water regime and are not represented in the BA surface water modelling. This includes 1028 km of temporary streams that are classified as ‘Temporary lowland’ (940 km) and ‘Temporary upland’ (89 km) in the surface water zone of potential hydrological change that are potentially impacted but not quantified. This includes upstream parts of the Bully, Lagoon, North, Sandy and Tomahawk creeks and the upstream reaches of the Carmichael River catchment (Figure 20 in Section 3.3).
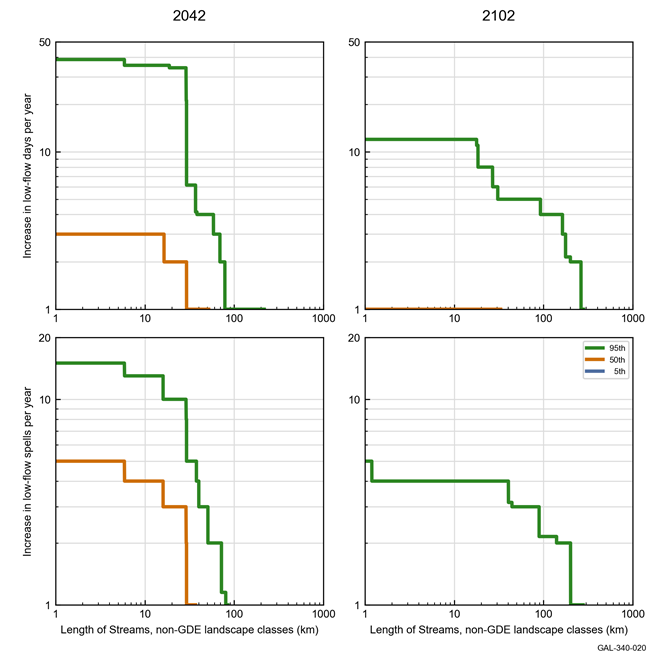
Hydrological modelling undertaken for this BA indicates that, in 2042, it is very unlikely that more than 69 km of streams will be affected by increases in modelled low-flow days in excess of 3 days (Figure 52 and Table 25). This includes Tallarenha Creek and parts of Alpha, Bully and Sandy creeks. It is very unlikely that modelled low-flow days will increase by more than 20 days along a 29 km stretch of Tallarenha Creek in this time period. The additional coal resource development is very unlikely to increase the number of modelled low-flow days by more than 3 days per year along more than 177 km of streams by 2102. This includes Tallarenha Creek and parts of Alpha, Native Companion and Sandy creeks (Figure 54).
Increases to average annual low-flow spells of more than 3 days are very unlikely to affect more than 51 km of modelled streams by 2042. This includes Tallarenha Creek and parts of Alpha and Bully creeks (Figure 53 and Table 26). In 2102, increased average annual low-flow spells of more than 3 days are very unlikely to affect more than 90 km of modelled streams in the ‘Streams, non-GDE’ landscape group, including Tallarenha Creek and parts of Alpha and Bully creeks (Figure 54).
There are no results for the 5th percentile of either of the hydrological response variables in 2042 or 2102 or for the 50th percentile in 2102. This is because, as shown in Figure 25 and Figure 26, there is zero stream length that exceeds any of the specified thresholds for increases in low-flow days or increases in low-flow spells at the 5th percentile of the hydrological modelling results in both 2042 and 2102 or at the 50th percentile in 2102.
GDE = groundwater-dependent ecosystem
Data: Bioregional Assessment Programme (Dataset 1)
ACRD = additional coal resource development; GDE = groundwater-dependent ecosystem
Data: Bioregional Assessment Programme (Dataset 9)
ACRD = additional coal resource development; GDE = groundwater-dependent ecosystem
Data: Bioregional Assessment Programme (Dataset 9)
Table 25 ‘Streams, non-GDE’ landscape group: length (km) of streams potentially exposed to varying increases in low-flow days per year (LQD) in 2042 and 2102 in the zone of potential hydrological change
Some totals reported here have been rounded. Columns containing zero values are shown to allow consistent comparison between tables.
GDE = groundwater-dependent ecosystem
Data: Bioregional Assessment Programme (Dataset 1)
Table 26 ‘Streams, non-GDE’ landscape group: length (km) of streams potentially exposed to varying increases in low-flow spells per year (LME) in 2042 and 2102 in the zone of potential hydrological change
Some totals reported here have been rounded. Columns containing zero values are shown to allow consistent comparison between tables.
GDE = groundwater-dependent ecosystem
Data: Bioregional Assessment Programme (Dataset 1)
3.4.5.3 Potential ecosystem impacts
During the receptor impact modelling, the key hydrological determinants of ecosystem function identified by the experts are related to the existence and connectivity of refuge habitats. Surface water serves an important role, with detritus and algae the principal resources that support populations of aquatic invertebrates and fishes. For the ‘High-flow macroinvertebrate’ receptor impact model, the experts’ opinion provides strong evidence that:
- mean mayfly nymph density would decrease by approximately 7% if mean number of low-flow days (LQD) increases by 20 days per year and all other model variables are held at their median values
- mean mayfly nymph density would decrease by approximately 7% if mean annual maximum spell of low-flow days (LME) increases by 20 days per year from 100 to 120 days per year and all other model variables are held at their median values.
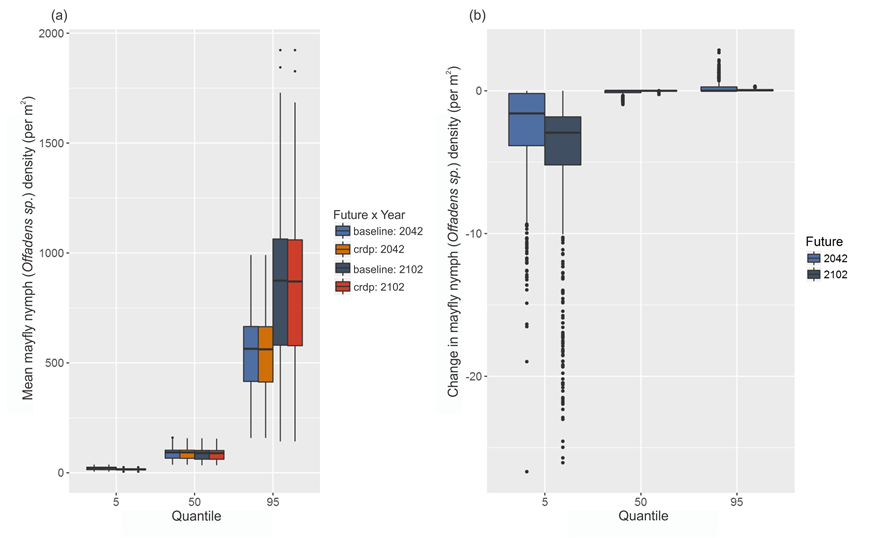
The median and 95th percentile estimates of the difference in mayfly nymph density due to additional coal resource development in the 30-year periods preceding 2042 and 2102 indicate no change from densities under the baseline (Figure 55). Results indicate a 5% chance that the hydrological change in some assessment units may translate to a decrease in mayfly nymph density of up to 27 mayfly nymphs per m2 in 2042 and 2102 due to additional coal resource development (Figure 55).
Overall ecosystem risk that combines understanding from the conceptual model of causal pathways, hydrological modelling and expert opinion was estimated based on the distribution of predicted impacts due to additional coal resource development. The overall level of risk presented here represents the highest level of risk estimated for each assessment unit in the zone. Assessment units where input data exist but the risk thresholds are not exceeded are classed as being ‘at minimal risk of ecological and hydrological changes’. Risk thresholds for the ‘High-flow macroinvertebrate’ receptor impact model are:
- ‘at some risk of ecological and hydrological changes’ decreases of greater than 20 mayfly nymphs per m2
- ‘more at risk of ecological and hydrological changes’ decreases of greater than 30 mayfly nymphs per m2.
The main non-GDE streams where receptor impact modelling indicated greater than ‘at minimal risk’ level is the lower part of the Belyando and Suttor rivers, upstream of Lake Dalrymple (Figure 56). Receptor impact variables were not calculated for 3795 (89%) assessment units of this landscape group in the zone of potential hydrological change as surface water hydrological changes were not quantified from the modelling. Of the 475 assessment units (see Section 3.2.4.1.2 for information about assessment units) where receptor impact variables were calculated, 21 (or 4%) are considered to be ‘at some risk’ and none are considered to be ‘more at risk’. Overall, there is some level of risk to less than 0.5% of ecosystems that rely on non-groundwater dependent streams in the zone. A more detailed and local consideration of risk needs to consider location-specific values that the community seeks to protect (e.g. particular assets) as that will help to identify meaningful risk thresholds. It is also necessary to incorporate other lines of evidence, including the magnitude of hydrological change and qualitative models.
GDE = groundwater-dependent ecosystem
Data: Bioregional Assessment Programme (Dataset 11)
ACRD = additional coal resource development; GDE = groundwater-dependent ecosystem
Data: Bioregional Assessment Programme (Dataset 11)

Product Finalisation date
- 3.1 Overview
- 3.2 Methods
- 3.3 Potential hydrological changes
- 3.4 Impacts on and risks to landscape classes
- 3.4.1 Overview
- 3.4.2 Landscape classes that are unlikely to be impacted
- 3.4.3 'Springs' landscape group
- 3.4.4 'Streams, GDE' landscape group
- 3.4.5 'Streams, non-GDE' landscape group
- 3.4.6 'Floodplain, terrestrial GDE' landscape group
- 3.4.7 'Non-floodplain, terrestrial GDE' landscape group
- References
- Datasets
- 3.5 Impacts on and risks to water-dependent assets
- 3.6 Commentary for coal resource developments that are not modelled
- 3.7 Conclusion
- Citation
- Acknowledgements
- Contributors to the Technical Programme
- About this technical product


