In assessing potential impacts on groundwater, changes are summarised by the hydrological response variable, dmax, which is the maximum difference in drawdown, obtained by choosing the maximum of the time series of differences between two futures. These dmax values are presented for the baseline (difference from a ‘no development’ model run) and due to additional coal resource development (difference from the baseline run). As there are no coal resource developments in the baseline for the Galilee subregion, the drawdowns under the baseline essentially represent the ‘no development’ model run.
Thresholds of greater than 0.2, 2 and 5 m of drawdown have been adopted to summarise groundwater modelling results across all BAs, as they represent meaningful changes for managing groundwater resources in NSW and Queensland. In Queensland, ‘make good’ obligations for groundwater bores affected by mining operations or CSG extraction apply under Queensland’s Water Act 2000, where water pressure is predicted to fall by more than 5 m for consolidated aquifers, such as sandstone, and 2 m for unconsolidated aquifers, such as sand. Additionally, Queensland’s Water Act 2000 also requires prevention or mitigation options to be developed for springs where predicted pressure reductions are greater than 0.2 m.
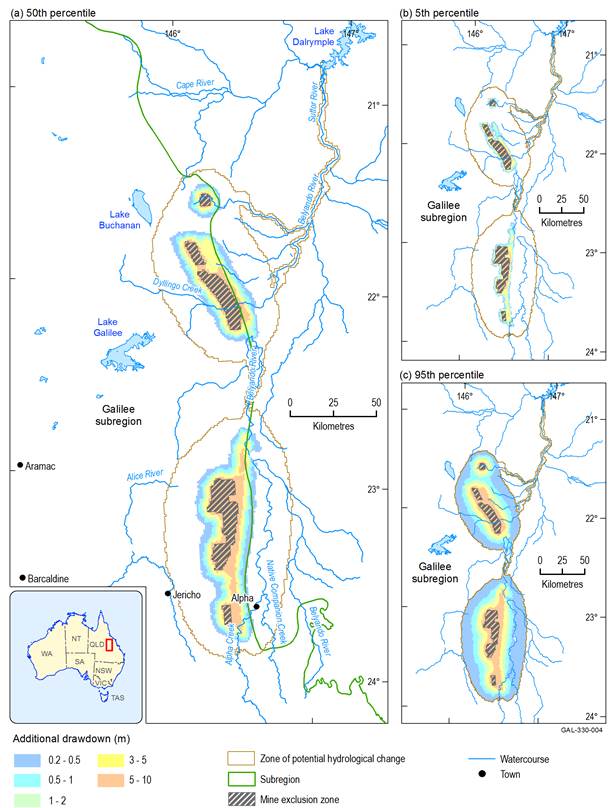
Groundwater drawdown results for the uppermost aquifer (Quaternary alluvium and Cenozoic sediments) modelled in the Galilee subregion are in Table 11 and shown in Figure 24, mapping the spatial extent of drawdown at the 5th, 50th and 95th percentiles of all modelling runs (as explained in companion product 2.6.2 for the Galilee subregion (Peeters et al., 2018) there were 10,000 different parameter combinations (i.e. model runs) evaluated using the AEM). These drawdown predictions are due to additional coal resource development. For additional drawdown greater than 0.2 m, the area of drawdown associated with the 5th percentile (2820 km2) can be interpreted as representing the extent of drawdown greater than 0.2 m when the model parameters reflect lower pumping rates and/or lower hydraulic conductivities of the various aquifers and aquitards. In contrast, the area of drawdown associated with the 95th percentile (13,364 km2) includes the model predictions based on the main aquifer parameters (e.g. hydraulic conductivity and specific storage) nearer the upper limits of their expected ranges. Groundwater drawdown predictions indicate that drawdowns of greater than 5 m are very likely (greater than 95% chance; 5th percentile) to occur in the immediate vicinity of open-cut and underground mining areas due to additional coal resource development outlined in Table 10. The median area (50th percentile) potentially impacted by greater than 5 m of drawdown is 1782 km2, which includes the 986 km2mine exclusion zone.
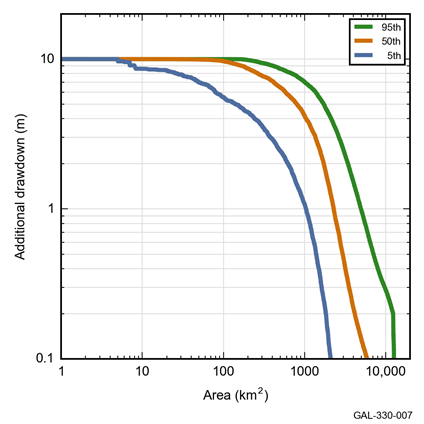
Cumulative exceedance plots provide a useful means to visualise areas exposed to differing levels of drawdown across the range of probabilistic results (Figure 25). As outlined in Section 2.6.2.5 of companion product 2.6.2 (Peeters et al., 2018), the maximum limit for additional drawdown in the AEM developed for this BA is constrained to 10 m in the uppermost alluvial aquifer along the boundary of each mine footprint. In the AEM, the 10 m level represents the complete dewatering of the Cenozoic sediment and Quaternary alluvial aquifer in each of the seven proposed coal mining areas.
Table 11 Surface area (km2) and stream lengths (km) potentially exposed to varying levels of additional drawdown in the zone of potential hydrological change
Due to rounding, some totals reported here may not correspond exactly with the sum of the separate numbers. The area potentially exposed to ≥0.2, ≥2 and ≥5 m additional drawdown for the 5th, 50th and 95th percentile estimates of the maximum difference in drawdown (dmax) between the coal resource development pathway (CRDP) and baseline, due to additional coal resource development. Drawdowns in the mine exclusion zones cannot be quantified with confidence.
Data: Bioregional Assessment Programme (Dataset 1)
Additional drawdown is the maximum difference in drawdown (dmax) between the coal resource development pathway (CRDP) and baseline, due to additional coal resource development. For the Galilee subregion there are no coal resource developments in the baseline, as there were no commercially producing coal mines or coal seam gas fields as at December 2012.
Data: Bioregional Assessment Programme (Dataset 1)
Additional drawdown is the maximum difference in drawdown (dmax) between the coal resource development pathway (CRDP) and baseline, due to additional coal resource development. Drawdown under the baseline for the Galilee subregion does not include any coal resource developments, as there were no commercially producing coal mines as at December 2012.
Data: Bioregional Assessment Programme (Dataset 1)
3.3.2.1.1 Exploring conceptual uncertainty and applying regional-scale groundwater models to local-scale impact assessment
In the context of this BA, evaluating the impacts to groundwater systems due to additional coal resource development relies on the probabilistic drawdown results generated from the AEM (as outlined in companion product 2.6.2 for the Galilee subregion (Peeters et al., 2018)). The groundwater model is based on a simplified hydrogeological conceptualisation of the main aquifers and aquitards (Section 3.2.3) that occur in and around the area of the seven coal mines that have been the focus of the modelling. This modelling approach is well suited to the primary BA objective of regional-scale, cumulative impact analysis across the Galilee assessment extent. In particular, the fast model run times allow for the evaluation of a very wide range of parameter combinations, and support the comprehensive uncertainty analysis.
With the available knowledge of the hydrogeological architecture and groundwater flow systems in the central-eastern Galilee subregion, the simplified conceptual framework that underpins the AEM (Figure 11) is regarded by the Assessment team as an appropriate basis for probabilistically determining the groundwater component of the zone of potential hydrological change. This approach allows for the evaluation of cumulative groundwater impacts due to multiple future mining operations. Consistent with the precautionary approach adopted by the BAs, there is a high level of confidence in the suitability of the zone for ruling out impacts to water-dependent assets and ecosystems (i.e. outside of the zone impacts are considered very unlikely to occur). This is because the modelling approach identifies the most sensitive model parameters and specifies a suitably wide (and conservative) parameter range that is biased towards large hydrological change predictions. Consequently, outside of the zone, the modelling predicts small probabilities (less than 5% chance) of very small changes (less than 0.2 m drawdown) to groundwater levels.
The strength of the AEM is clearly targeted towards the type of regional-scale analysis required for the BA for the Galilee subregion. However, the existing data and knowledge of the basin’s hydrogeology and groundwater systems was relatively limited at the outset of the BA. In addition, there was further uncertainty around many aspects of the proposed coal resource developments, and the way that the natural hydrological systems would likely respond to such development pressures. Overall, these various sources of uncertainty have meant that the conceptual system-level understanding supporting the modelling is of relatively low resolution. In addition, the AEM has limited capability to represent spatially varying thickness, hydraulic parameters and spatial extents of the different aquifers and aquitards (if known), and is unable to incorporate any local-scale hydrogeological data or information into the general conceptual framework (e.g. local faults or variably thick aquifers cannot be specified in the AEM configuration, even if they are known to exist).
The limitations of the AEM effectively mean that it is not well suited to making highly accurate local-scale predictions of drawdown impact for some areas within the zone of potential hydrological change. This is reflected in the commonly large uncertainty intervals that occur at some locations in the model domain where predicted changes are relatively substantial. Certainly, the Assessment team cautions against the wholesale adoption of the point-scale predictions presented in companion product 2.6.2 (Peeters et al., 2018) without undertaking further local-scale analysis to incorporate higher resolution data and knowledge that will then allow for more accurate quantification of hydrological impacts.
The relatively low resolution, regional-scale conceptualisation that underpins the drawdown predictions from the AEM means that the results at some individual locations in the zone are likely to be overestimated. There are several explanations for these overestimated drawdowns, with one of the main reasons being the way that the coal mining operations (i.e. dewatering) are implemented in the AEM. Consistent with the regional conceptualisation, coal mines can dewater from the confined upper Permian coal measures, as well as from the unconfined shallow Cenozoic sediment aquifer in the vicinity of the mines (companion product 2.6.2 (Peeters et al., 2018)). Thus, there are two main pathways for drawdown to propagate to aquifers throughout the AEM domain:
- lateral propagation of drawdown through the Quaternary alluvium and Cenozoic sediment layer and potentially also downwards to underlying hydrostratigraphic units such as the Clematis Group. This pathway simulates aquifer drawdown and drainage that can occur around open-cut mines where they intersect shallow (near-surface) aquifers
- laterally (at depth) through the upper Permian coal measures and then vertically upwards through the overlying Rewan Group aquitard, and then into other shallower aquifers such as the Clematis Group, as well as the Quaternary alluvium and Cenozoic sediments.
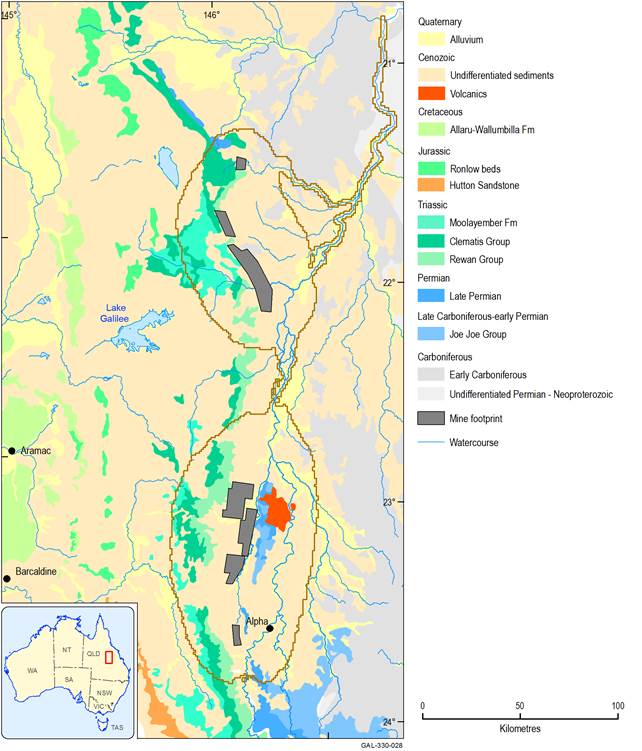
As explained in Section 2.6.2.8.2 of companion product 2.6.2 for the Galilee subregion (Peeters et al., 2018), this assumption is deemed appropriate for the regional-scale analysis used to define the zone of potential hydrological change, especially given the wide spatial extent and substantial thickness of Quaternary alluvium and Cenozoic sediment cover throughout the zone (Figure 27). However, it is unlikely to be a valid conceptualisation in areas where this unconsolidated sediment aquifer does not occur (or where it exists only in isolated areas that are not laterally contiguous with the mines), given that the first drawdown pathway mentioned above cannot exist under these circumstances.
Companion product 2.6.2 (Peeters et al., 2018) highlighted that a relatively simple change in the conceptualisation used in the AEM for the Galilee subregion can produce substantially different probabilistic drawdown predictions at individual locations. To reveal the extent to which alternative conceptual models can influence groundwater predictions within the zone, the AEM was run 10,000 times for two different approaches (with detailed results and discussion presented in Section 2.6.2.8 of companion product 2.6.2 (Peeters et al., 2018)). The original conceptualisation allowed the AEM to simulate drawdown via the two pathways mentioned above (i.e. pathway 1 and pathway 2). This approach simulates drawdown and drainage of shallow aquifers that may occur due to excavation of open-cut mine pits through the near-surface layers, as well as drawdown that can propagate laterally from the deeper coal-bearing unit to shallower layers via intervening aquitards. The second approach (the alternative conceptualisation), only allowed for drawdown to occur via pathway 2, which assumes that open-cut mine developments have no direct interaction with the near-surface aquifers, except via drawdown propagating vertically upwards from the deeper coal-bearing layer (which is impeded by the aquitard layers of the Rewan Group and the low permeability basal layer of the Cenozoic sediments).
Focusing on results at three specific locations near the Carmichael River (receptor locations GAL_021, GAL_037 and GAL_043), the results presented in Figure 26 indicate that removing the constant drawdown condition in the alluvial/sediment aquifer (which simulates the effects of completely dewatering this upper aquifer due to mining) causes large variations in the predicted drawdown (dmax) at GAL_021 and GAL_037 (i.e. difference shown between the original and alternative conceptualisations). The median dmax values at the Carmichael GDE location decrease from 0.29 m to 0.02 m, while at Doongmabulla Springs, the median dmax values drop from 0.88 m to 0.18 m. The dmax values at Mellaluka Springs are not noticeably affected by the conceptual model change, as drawdown at these springs is only dependent on changes in the upper Permian coal measures.
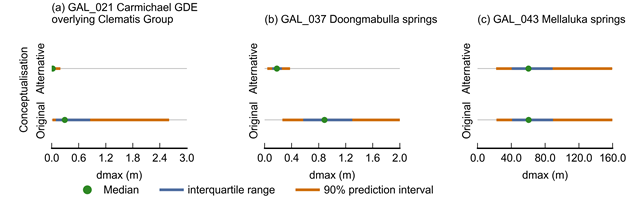
As explained in the preceding text, the original conceptualisation has two potential drawdown pathways emanating from the various coal mining operations, whereas the alternative conceptualisation involves only a single drawdown pathway via the upper Permian coal measures. Consequently, drawdown predictions for any model nodes in AEM layer 1 (Quaternary alluvium and Cenozoic sediments), such as GAL_021, and AEM layer 3 (Clematis Group), such as GAL_037, will have smaller dmax values for the alternative conceptualisation than for the original conceptualisation. However, dmax values are the same for any model nodes in the upper Permian coal measures. Additional drawdown is dmax, the maximum difference in drawdown between the coal resource development pathway (CRDP) and baseline, due to additional coal resource development.
GDE = groundwater-dependent ecosystem
Data: Bioregional Assessment Programme (Dataset 7)
As discussed in companion product 2.6.2 (Peeters et al., 2018), the variation in model results in Figure 26 highlights that at local sites near the mines, in the unconfined aquifer (Quaternary alluvium and Cenozoic sediments) and the underlying confined Clematis aquifer, most of the simulated drawdown is caused by the constant drawdown boundary in the unconfined aquifer (which assumes the existence of a laterally continuous unconfined aquifer). In areas where this assumption is not valid (e.g. in areas of outcropping Triassic rock units), the predictions can be overestimated by up to an order of magnitude. Despite its closer proximity to the mine, the dmax values at the Carmichael GDE (GAL_021) are smaller than at Doongmabulla Springs (GAL_037). This is because the model node associated with Doongmabulla Springs is situated in the model layer containing the confined Clematis Group aquifer, where the storage is orders of magnitude smaller than in the overlying unconfined aquifer in which the Carmichael GDE model node is situated. For the same change in groundwater flux, the smaller storage will lead to a larger drawdown. Further discussion about potential impacts at Doongmabulla Springs, factoring in the drawdown results of the alternative conceptualisations presented above (and discussed in more detail in companion product 2.6.2 (Peeters et al., 2018)), is presented in Section 3.4.3 and Section 3.5.2.
Other factors that potentially lead to overestimated drawdown extents or predictions for the Quaternary alluvium and Cenozoic sediment aquifer, as well as the Clematis Group aquifer include:
- The uppermost model layer(alluvium and sediment aquifer) does not actually exist across the entire zone of potential hydrological change (as shown in Figure 27) as a continuous 10 m thick and evenly distributed layer with the same hydraulic properties (i.e. this upper aquifer is not an isotropic and homogenous layer as represented in the model). Thus, the model over estimates the areal extent of drawdown in the upper aquifer layer, as it assumes that drawdown can propagate throughout a laterally continuous and homogenous shallow sediment layer that does not actually exist in some areas of the zone.
- In areas where the Permian or Triassic rock units occur at the surface (i.e. areas where no Cenozoic sediments exist, as shown in Figure 27), the generally lower hydraulic conductivities of these weathered and/or consolidated rock units are likely to impede propagation of modelled drawdown in the unconfined aquifer. For example, in the southern zone, a ridge of Late Carboniferous to Permian sedimentary rocks forms a prominent topographic high that is likely to form an effective barrier to continuous groundwater connection in the uppermost aquifer. This ridgeline separates the Alpha Creek – Native Companion Creek valley from the Lagoon Creek – Sandy Creek valley to the west (in the area where the southern cluster of coal mines is proposed, see Figure 27).
The simulated changes in surface water – groundwater exchange flux are also likely to be overestimated. In addition to the assumption that the unconfined aquifer is continuous between every mine pit and the Belyando River, it assumes that the Belyando River system is a regional discharge feature in which there is always water available.
Considering the information presented above, model results in companion product 2.6.2 (Peeters et al., 2018) are likely to be most applicable in areas where there are laterally extensive sheets of Cenozoic sediments with saturated thickness of at least 10 m. In the zone of potential hydrological change, these areas are most likely to occur east of the outcropping Triassic rock units of the Moolayember Formation, Clematis Group and Rewan Group, along the eastern flank of the Great Dividing Range (these are shown in Figure 27 as either the yellow or pale orange areas in the central and eastern parts of the zone). Areas of the zone where the layer 1 drawdown results from the AEM may be less applicable are where extensive outcrop areas of pre-Cenozoic rocks occur (e.g. in areas of Triassic rock units such as the Moolayember Formation and Rewan Group, which are shown in darker green in Figure 27), or where the Quaternary alluvium is restricted to confined valleys, and does not exist as an extensive sheet-like layer.
Table 12 compares the extents of the main stratigraphic units in the zone of potential hydrological change for two different sources of geological data that cover the Galilee Basin, namely the National surface geology of Australia 2012 dataset (Geoscience Australia, Dataset 8), and the Geology of Queensland 2012 dataset (Geological Survey of Queensland, Dataset 9). For these two surface geology datasets, the respective areal extents of the Quaternary alluvium and Cenozoic sediments, the various Galilee Basin units (Moolayember Formation, Clematis Group – Warang Sandstone and Dunda beds – Rewan Group) and the older Carboniferous rock units are approximately similar (Table 12). However, at local scales there may be important differences in the areal extents of the main stratigraphic units within the zone of potential hydrological change. For example, the 2012 national surface geology dataset published at 1 million scale (Geoscience Australia, Dataset 8) indicates that Cenozoic sediments occur continuously along most of the Carmichael River valley and its tributaries (although the map does not indicate variations in alluvial sediment thickness along the valley). In contrast, the Queensland Geological Survey’s 2012 state geology dataset (published at 2 million scale) does not indicate that any alluvium occurs along the valley of the Carmichael River.
Local variations in geology within the zone of potential hydrological change are further highlighted from more detailed geological mapping, such as finer-scale individual mapsheets at 100,000 scale. For example, on the Mount Tutah mapsheet (DME, 2008) there are notable differences in the distribution of Galilee Basin stratigraphic units and Cenozoic sediments, such as outcrop areas classified as Rewan Group on coarser-scale maps depicted as Moolayember Formation outcrop at 100,000 scale. This is an example of one of the many complexities that can arise when downscaling regional mapping and modelling results to local features. As outlined in companion product 2.1-2.2 for the Galilee subregion (Evans et al., 2018a), there is clearly the need for coordinated revision and refinement of geological mapping for the central-eastern margin of the Galilee Basin (see Section 3.7.4 for further details on future research opportunities). New data and interpretations arising from such work would help to improve any future conceptualisation of local-scale groundwater modelling and impact analysis in this area. As an example, some of the ongoing geological mapping work outlined in Hansen and Uroda (2017) could be used as part of future investigations to further improve understanding of the local hydrogeology and geology in areas near the eastern margin of the Galilee Basin.
Table 12 Comparison of main geological units mapped at surface within the zone of potential hydrological change
na = not applicable
Data: Bioregional Assessment Programme (Dataset 8, Dataset 9)
Data: Bioregional Assessment Programme (Dataset 2), Geological Survey of Queensland (Dataset 9)
3.3.2.1.2 Applying groundwater modelling results for impact and risk analysis of the Galilee subregion
Throughout this product, the modelling results generated by applying the original groundwater conceptualisation (as previously discussed in Section 3.3.2.1.1) are primarily used for the impact and risk analysis. This conceptualisation is considered to be the most appropriate for assessing the regional-scale, cumulative impacts of coal resource development on hydrology and ecosystems in the Galilee assessment extent, and is thus used as the basis for defining the groundwater component of the zone of potential hydrological change and undertaking the analysis presented throughout this section (Section 3.3) and Section 3.4 (impacts and risks to landscape classes). However, for some specific ecological assets (e.g. some springs), the analysis presented in Section 3.5 may utilise the groundwater results from the alternative conceptualisation. This is done in cases where, on the basis of the available evidence, the Assessment team considers that the results generated by the alternative conceptualisation are more locally applicable than those from the original conceptualisation. In particular, detailed analysis of potential impacts to assets that occur within the ‘Springs’ landscape group are presented in Section 3.5.2.6, where the results from the two groundwater model conceptualisations are compared to better understand the likely groundwater responses for some spring-related assets.
A final important point here is that the AEM outputs from the alternative conceptualisation have not been used in this BA to define any type of ‘alternative zone of potential hydrological change.’ This is because the primary purpose of the zone is to rule out areas of the assessment extent from potential impact due to additional coal resource development. As explained previously, the drawdown predictions in the Quaternary alluvium and Cenozoic sediment layer (AEM layer 1) from the alternative conceptualisation will always cover a much smaller range (i.e. from 5th to 95th percentile results) at any particular point than the range from the original conceptualisation. This effectively means that the extent of the zone (as developed for this BA using the original conceptualisation) will completely enclose the area that would be defined on the basis of the 0.2 m drawdown threshold at the 95th percentile using the alternative approach. Thus, there is no need to develop an ‘alternative zone’ for the purposes of this BA as it would be substantially smaller in extent than the existing zone, and would likely also further complicate the presentation of results from this BA.
