The hydrological response variables generated from the surface water modelling are listed in companion product 2.6.1 for the Galilee subregion (Karim et al., 2018b). Three of the eight hydrological response variables were selected for further analysis, and were chosen to represent changes in low-flow regime (ZFD – zero-flow days), high-flow regime (FD – high-flow days) and mean annual flow (AF) due to additional coal resource development. The model values for the additional coal resource development reflect the maximum difference between streamflow time series under the CRDP and baseline (which has no coal resource development) from the top 10% of simulations (i.e. 347) for each hydrological response variable.
3.3.3.1 Zero-flow days
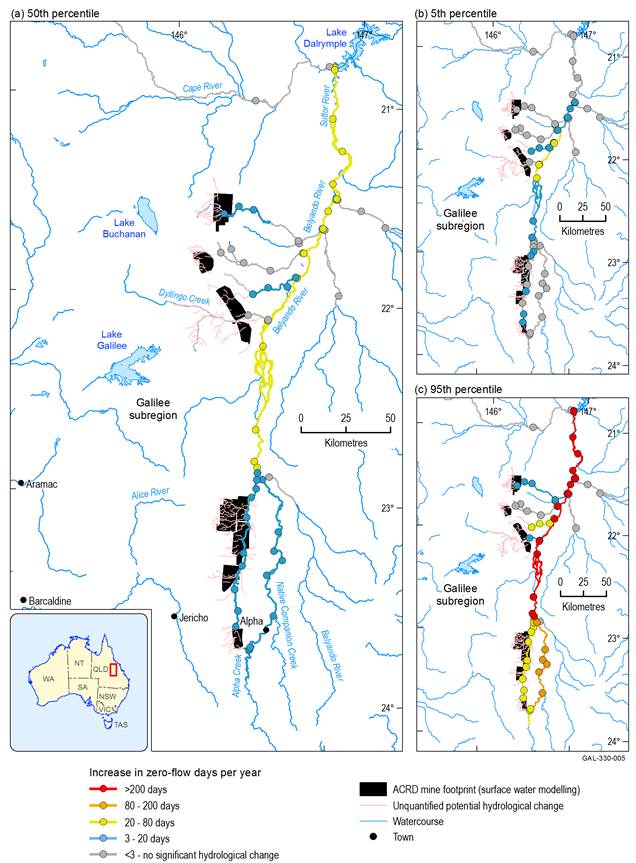
As defined in companion product 2.6.1 (Karim et al., 2018b), a zero-flow day in the BA for the Galilee subregion is one when streamflow is less than 1 ML/day from the simulated 90-year period (2013 to 2102) for that stream. The modelled increases in the number of zero-flow days due to additional coal resource development in the Galilee zone of potential hydrological change are compiled in Table 13, and shown spatially in Figure 28. Streams denoted as ‘unquantified potential hydrological change’ are likely to experience an increase in zero-flow days due to additional coal resource development. However, results from the nearby upstream or downstream model nodes cannot be reliably interpolated to these reaches due to assumed (but non-modelled) hydrological changes along the reach (e.g. from tributary inflows) or from more direct impacts of coal mining operations. An indication of the potential increases in zero-flow days in the ‘potential hydrological change’ reaches near mining operations can be inferred from stream reaches immediately upstream and/or downstream, where the potential increases in zero-flow days have been quantified.
At the 95th percentile, about 18% (or 1108 km) of the entire stream network (6285 km) in the surface water zone of potential hydrological change is predicted to experience increases of at least 3 days per year in the number of zero-flow days (as per the zero-flow threshold definition in Table 9). This includes Sandy Creek – Lagoon Creek, which runs adjacent to the southern cluster of mines; parts of the Belyando River downstream of its confluence with Sandy Creek to Lake Dalrymple (Burdekin Falls Dam); the Carmichael River downstream of the proposed Carmichael Coal Mine; and several of the east-flowing creeks that drain the northern reporting area, for example, North Creek and Bully Creek. Modelling suggests it is very unlikely (less than 5% chance) that there will be increases in zero-flow days due to additional coal resource development in the Cape River or the reaches of the Suttor River that are upstream of its junction with the Belyando River.
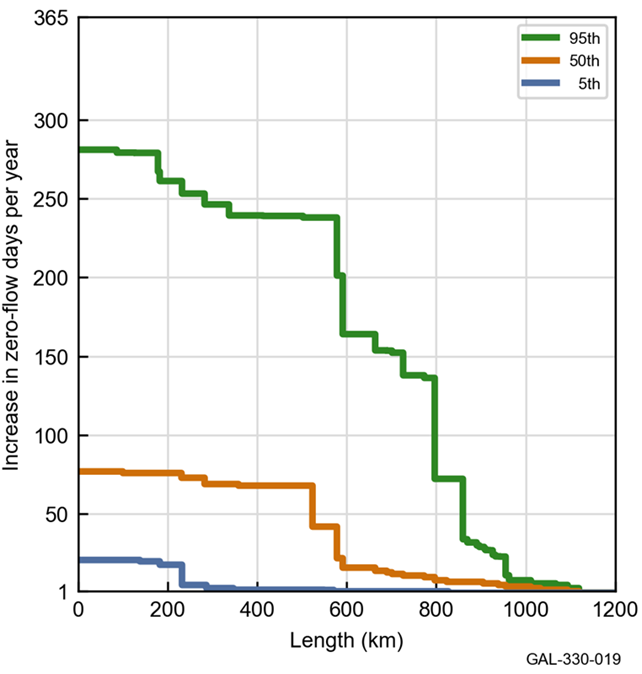
The median stream length with at least 3 days per year increase in zero-flow days is only slightly less than the total stream length at the 95th percentile, with 1034 km of streams exceeding the minimum zero-flow day threshold at the median result. Another 1781 km of streams are flagged as potentially impacted in the surface water zone, but surface water changes could not be quantified for these reaches due to various reasons (as previously explained in Section 3.3.1.2). The cumulative exceedance plots of stream length with additional zero-flow days in Figure 29 and the underpinning data in Table 13 indicate the progressive decrease in impacted stream lengths at higher thresholds. For example, about 956 km of streams have at least an increase of 20 days per year of zero flow at the 95th percentile, whereas 798 km of modelled streams have an increase of at least 80 days per year (95th percentile). Increases in zero-flow days above the 200-day maximum range shown in Figure 28 are only evident at the 95th percentile, with 591 km of streams predicted to experience at least this amount of impact. These large increases in zero-flow days mainly occur in the northern reporting area, and potentially affect a near-continuous stretch of the Belyando River over several hundred kilometres (Figure 28). In contrast, the Belyando River is not expected to be impacted due to additional coal resource development in the southern part of the zone, until it reaches the junction with Native Companion Creek.
Modelled increases in the number of zero-flow days are largest along the main reaches of the Belyando River and the part of the Suttor River downstream of its junction with the Belyando (Figure 28). This indicates that changes in the low-flow regime are likely to be more substantial for reaches where impacts from multiple mining operations can combine and cumulatively affect downstream sections of the main river system (as opposed to smaller tributaries that may occur closer to individual mines, but are not influenced by multiple mining operations). In analysing these low-flow modelling results, it is important to be aware that many reaches of the Belyando and Suttor rivers that show a 5% chance of more than an additional 200 zero-flow days (Figure 28) may not actually flow for 200 days (or more) in most years. However, in some very wet years, these rivers can receive considerable inflows and it is possible for over 200 days of streamflow to occur. For example, available stream gauge data for the Belyando River at the Gregory Development Road Crossing (Queensland gauge 120301B) from late May 2005 to late November 2007 indicate that streamflow occurred at this site approximately 250 days per year over this period (Queensland Government, 2017). Hence, the apparent anomalous increase in zero-flow days observed from the hydrological modelling occurs entirely as a result of the potential for these particularly wet years to occur across the 90-year simulation period. As the surface water modelling in the BAs focuses on the maximum change in zero-flow days due to additional coal resource development, the reporting is biased towards these wet years when the maximum changes in the low-flow regime can occur. This means that the maximum reduction in zero-flow days is most likely to occur in a very wet year, around the time when the maximum mine footprint is developed.
Table 13 Stream length (km) potentially exposed to varying increases in zero-flow days in the zone of potential hydrological change
Due to rounding, some totals reported here may not correspond exactly with the sum of the separate numbers.
Data: Bioregional Assessment Programme (Dataset 1)
Figure 28 Increases in the number of zero-flow days due to additional coal resource development
ACRD = additional coal resource development
Data: Bioregional Assessment Programme (Dataset 1, Dataset 6)
Data: Bioregional Assessment Programme (Dataset 1)
To understand the significance of the modelled increases in zero-flow days, it is useful to look at them in the context of the interannual variability in zero-flow days due to climate. In other words, are the predicted increases due to additional coal resource development within the natural range of variability of the longer-term flow regime in this river basin? If so, then this may suggest that the system is adapted to the range of possible increases that may be expected due to additional coal resource development. Alternatively, are the modelled increases potentially able to shift the system outside of the range of hydrological variability it experiences under the baseline climate? If the latter case, the system may be less able to adapt to the changes in hydrology due to additional coal resource development.
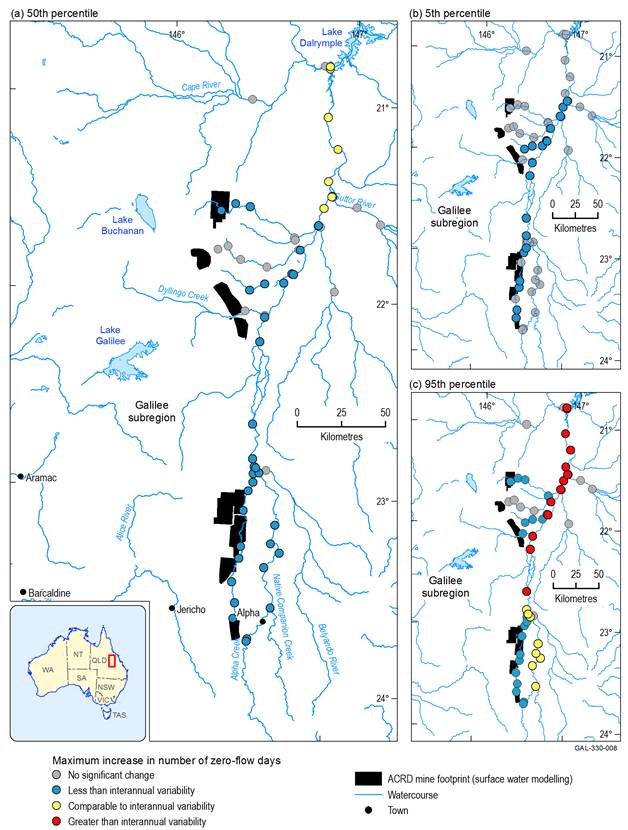
The maximum increase in the number of zero-flow days due to additional coal resource development relative to the interannual variability in zero-flow days under the baseline has been adopted to provide some degree of context around the modelled changes. This ratio is shown qualitatively for each surface water model node in Figure 30. Table 14 provides the ratio ranges for zero-flow days, high-flow days and annual flow volume that were selected for each qualitative ratio class in Figure 30. It is important to be aware that the changes shown in Figure 30 represent the maximum change due to additional coal resource development in a single year relative to the interannual variability across 90 years (2013 to 2102) under the baseline. Thus, it is not a comparison of distributions, but an assessment of whether the change due to additional coal resource development, in the year of maximum difference between the CRDP and the baseline, is within the range of natural variability. If the maximum change is small relative to the interannual variability due to climate (e.g. an increase of 3 days relative to a baseline range of 20 to 50 days), then the risk of impacts from the changes in zero-flow days is likely to be low. If the maximum change is comparable to or greater than the interannual variability due to climate (e.g. an increase of 200 days relative to a baseline range of 20 to 50 days), then there is a greater risk of impact on the landscape classes and assets that rely on this water source.
Table 14 Ratio of increase in the number of zero-flow days (ZFD), high-flow days (FD) and annual flow volume (AF) due to additional coal resource development to the interannual variability in low-flow days under the baseline
FD = high-flow days – in previous products, this is referred to as ‘flood days’
At the 5th percentile (Figure 30b), the predicted changes in zero-flow days represent no significant change or are less than the interannual variability at all model nodes. At the 50th percentile (Figure 30a), the modelled changes are mostly less than the baseline variability, except for the nodes on the northern-most stretches of the Belyando and Suttor rivers upstream of Lake Dalrymple, particularly for the nodes downstream of the Belyando River junction with the Suttor River. Along this stretch, the zero-flow day changes are largely comparable to the baseline interannual variability (i.e. the model nodes shown in yellow in Figure 30a). In contrast, results at the 95th percentile (Figure 30c) indicate that much of the Belyando River (and the Suttor River downstream of the Belyando junction) is expected to be impacted by increases in zero-flow days above the baseline interannual variability, especially in the northern reporting area (i.e. model nodes shown in red in Figure 30c). In the southern part of the zone, the predicted increases in zero-flow days are less than or comparable to the interannual variability typically experienced under baseline conditions.
The extent of the coal resource developments in the coal resource development pathway (CRDP) is the union of the extents in the baseline and in the additional coal resource development (ACRD).
Data: Bioregional Assessment Programme (Dataset 1, Dataset 6, Dataset 10)
3.3.3.2 High-flow days
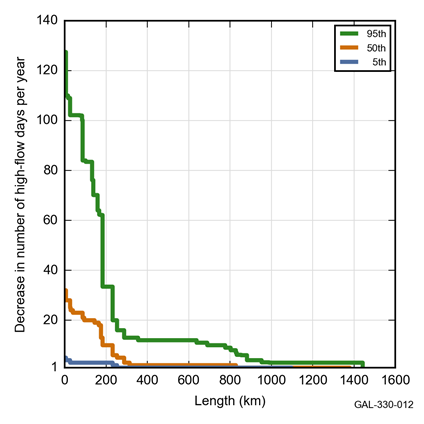
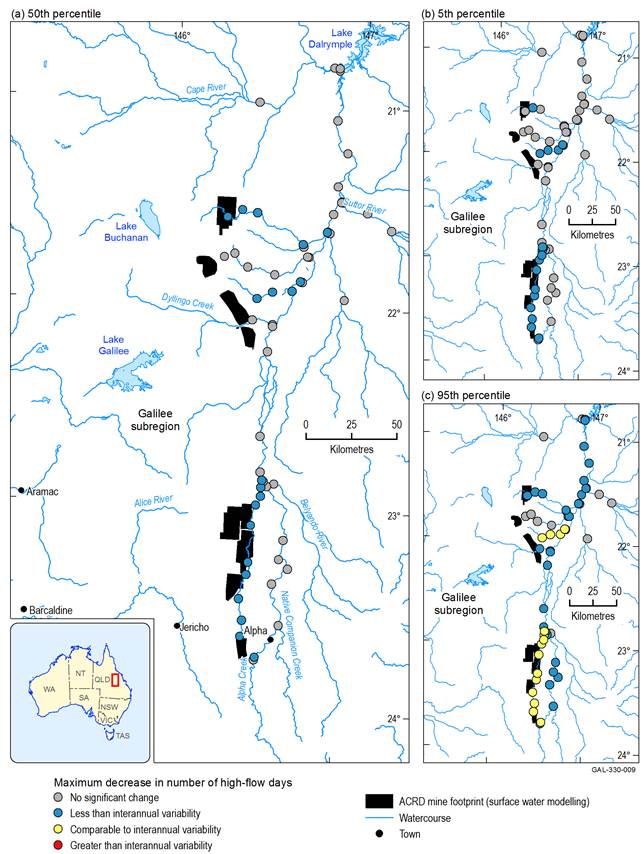
As stated in companion submethodology M06 (as listed in Table 1) for surface water modelling (Viney, 2016), a high-flow day is defined as one in which the streamflow exceeds the 90th percentile of flow from the simulated 90-year period (2013 to 2102) for that stream. The modelled reductions in the number of high-flow days for the 5th, 50th and 95th percentiles due to additional coal resource development in the Galilee subregion are shown in Figure 31. Reductions in high-flow days of at least 3 days per year are very likely (greater than 95% chance) along Lagoon Creek – Sandy Creek, where it runs adjacent to the proposed coal mines at China First, Alpha and Kevin’s Corner in the southern part of the zone, and in the northern part of the zone along North Creek. For the median result, similar nodes and reaches at Lagoon Creek – Sandy Creek and North Creek are expected to experience reductions in high-flow days of between 10 and 20 days each year. Most of Bully Creek (which has the proposed Hyde Park Coal Mine in the headwater area) is also expected to have reductions of at least 3 days of high-flow days per year. Most other parts of the modelled stream network at the 5th and 50th percentiles are not expected to have significant hydrological changes. It is only at the 95th percentile of all modelling runs that any streams (totalling less than 200 km) will have reductions in high-flow days in excess of 50 days per year (Table 15); these are mainly confined to the aforementioned stretches of Lagoon Creek – Sandy Creek in the southern zone, and North Creek in the northern zone. Interestingly, the most northern nodes and reaches of the Belyando – Suttor River (above Lake Dalrymple), which experienced the most substantial increases in zero-flow days of anywhere in the modelled stream network (at the 95th percentile), represent some of the least impacted of the modelled stream network when decreases in high-flow days are considered. These differences indicate that coal mining activities that impact directly on overland flow such as interception by open-cut pits are more likely to lead to reductions in high streamflow variables. Conversely, those activities that are mediated via groundwater (e.g. though depressurisation of aquifers) are more likely to lead to changes in low streamflow variables.
A cumulative exceedance plot of the reductions in high-flow days is shown in Figure 32, and the summary data are presented in Table 15 – including the length of potentially impacted but not quantified streams (which are not shown in Figure 31). At the 95th percentile, the total length of the modelled stream network potentially impacted by reductions of at least 3 high-flow days is 1430 km, and about 65% of these streams are in the northern part of the zone. In contrast, for streams that are predicted to have reductions in high-flow days of greater than 50 days per year, about 86% of the total occurs in the southern part of the zone (Table 15). A further 1460 km of streams are classified as potentially impacted but not quantified.
The comparison of maximum change in high-flow days due to additional coal resource development and interannual variability in high-flow days under the baseline (Figure 33) shows that at most nodes, the maximum change is relatively small compared to interannual variability and that the predicted changes are unlikely to increase the stress on these streams. Generally, the impact of additional coal resource development on high-flow days is not as great as it is on low-flow days. It is very unlikely that impacts on high-flow days at any model nodes will exceed the baseline interannual variability.
Figure 31 Decrease in the number of high-flow days due to additional coal resource development
Data: Bioregional Assessment Programme (Dataset 1, Dataset 6, Dataset 10)
Table 15 Stream length (km) potentially exposed to varying reductions in high-flow days in the zone of potential hydrological change
Due to rounding, some totals reported here may not correspond exactly with the sum of the separate numbers.
Data: Bioregional Assessment Programme (Dataset 1)
Data: Bioregional Assessment Programme (Dataset 1)
The extent of the coal resource developments in the coal resource development pathway (CRDP) is the union of the extents in the baseline and in the additional coal resource development (ACRD).
Data: Bioregional Assessment Programme (Dataset 1, Dataset 6, Dataset 10)
3.3.3.3 Annual flow
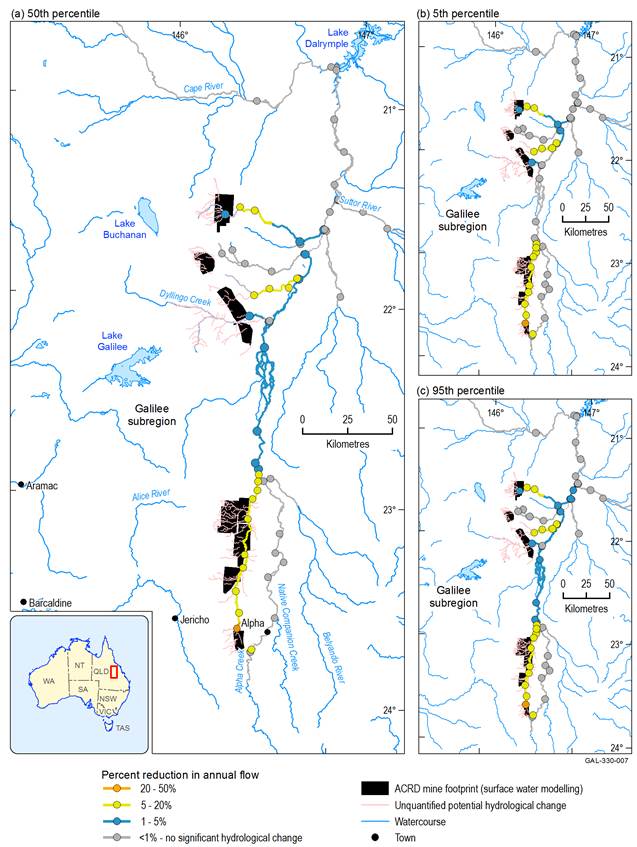
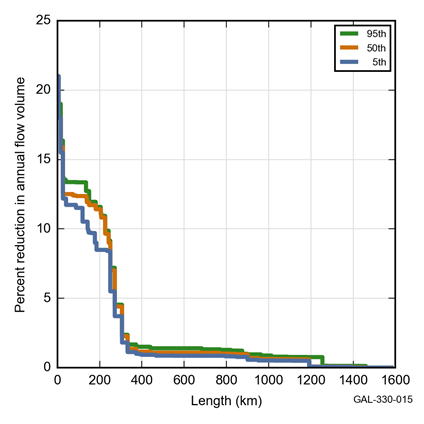
The annual flow (AF) represents the maximum percentage change in the mean annual flow volume (GL/year) over the simulated 90-year period (2013 to 2102) due to additional coal resource development. This is shown in Figure 34 for stream reaches in the surface water zone of potential hydrological change. A cumulative exceedance plot of the reduction in annual flow is shown in Figure 35, with summary data presented in Table 16. The spatial distribution of changes in annual flow show many similarities across the 5th, 50th and 95th percentiles, and these similarities are further emphasised by the high degree of overlap between individual lines in the cumulative exceedance plot (Figure 35).
The extent of the modelled stream network subject to at least a 1% reduction in mean annual flow volume at the 95th percentile is 886 km, with a median of 833 km. A further 1442 km of streams are potentially impacted by changes in annual flow, but changes in these streams could not be quantified. Only 6 km of the stream network is likely to experience greater than 20% reduction in annual flow volume, and this occurs just downstream of the proposed South Galilee Coal Mine on Tallarenha Creek (near node 3). These results are consistent at the 5th, 50th and 95th percentiles. Similarly, the 269 km of stream network expected to have greater than 5% reduction in annual flow is consistent regardless of the percentile. The streams that are predicted to have the greatest reductions in annual flow are:
- Tallarenha Creek – Lagoon Creek, where the stream starts near South Galilee and flows northwards adjacent to the three neighbouring mines in the southern cluster at China First, Alpha and Kevin’s Corner
- North Creek, which flows in an easterly direction from the area of the proposed Carmichael and China Stone mines towards the Belyando River
- Bully Creek, some segments just downstream of the Hyde Park Coal Project.
The similarity of annual flow decreases for all three percentiles (at thresholds above 1% reduction) is because reduction in annual flow is driven primarily by direct interception of surface runoff by open-cut mines and areas of mine-site infrastructure. The probability of this reduction does not vary. Only a small component of the reduction in annual flow is driven by changes in baseflow due to reduced surface water – groundwater connectivity.
The maximum change in annual flow due to additional coal resource development relative to the interannual variability of annual flow under the baseline is shown for each surface water node in Figure 36. At all nodes for the 5th and 50th percentile results, the maximum change in annual flow due to additional coal resource development is either not significant or is less than the interannual variability under the baseline. It is only at the 95th percentile for the various surface water nodes that occur on Sandy Creek, North Creek and Bully Creek that the annual flow changes may be considered comparable to baseline variability (Figure 36).
Figure 34 Decrease in annual flow due to additional coal resource development
The extent of the coal resource developments in the coal resource development pathway (CRDP) is the union of the extents in the baseline and in the additional coal resource development (ACRD).
Data: Bioregional Assessment Programme (Dataset 1, Dataset 6)
Data: Bioregional Assessment Programme (Dataset 1)
Table 16 Stream length (km) potentially exposed to varying reductions in percentage annual flow in the zone of potential hydrological change
Due to rounding, some totals reported here may not correspond exactly with the sum of the separate numbers.
Data: Bioregional Assessment Programme (Dataset 1)
The extent of the coal resource developments in the coal resource development pathway (CRDP) is the union of the extents in the baseline and in the additional coal resource development (ACRD).
Data: Bioregional Assessment Programme (Dataset 1, Dataset 6, Dataset 10)
Product Finalisation date
- 3.1 Overview
- 3.2 Methods
- 3.3 Potential hydrological changes
- 3.4 Impacts on and risks to landscape classes
- 3.4.1 Overview
- 3.4.2 Landscape classes that are unlikely to be impacted
- 3.4.3 'Springs' landscape group
- 3.4.4 'Streams, GDE' landscape group
- 3.4.5 'Streams, non-GDE' landscape group
- 3.4.6 'Floodplain, terrestrial GDE' landscape group
- 3.4.7 'Non-floodplain, terrestrial GDE' landscape group
- References
- Datasets
- 3.5 Impacts on and risks to water-dependent assets
- 3.6 Commentary for coal resource developments that are not modelled
- 3.7 Conclusion
- Citation
- Acknowledgements
- Contributors to the Technical Programme
- About this technical product

