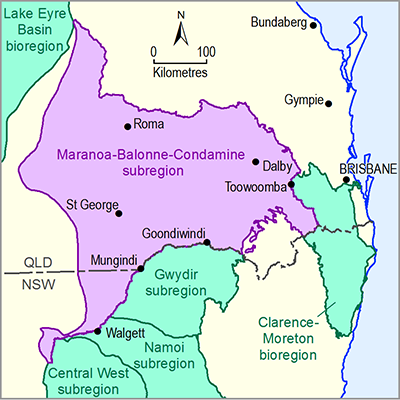
Net recharge values are estimated in the steady-state model calibration by allowing recharge rates to vary on a zonal basis in the uppermost model cell in each active layer. ‘In most zones, recharge was allowed to vary between 1 and 30 mm/yr based on maximum and minimum long-term average estimates included in Kellett et al. (2003)’ (GHD, 2012, p. 59). Watertable recharge values are considered to be potential recharge values as ‘a significant proportion of these applied potential rates will be rejected, resulting in modelled net or effective recharge rates which are comparable with the estimates of Kellett et al. (2003)’ (GHD, 2012, p. 60). Watertable recharge to the Main Range Volcanics is allowed to vary between 20 and 30 mm/year to maintain consistency with regional-scale recharge estimates of 23 to 28 mm/year included in the Murray–Darling Basin Authority Basin Plan (GHD, 2012). Initial watertable recharge values used in the OGIA model are shown in Table 4.
The Condamine Alluvium is modelled using an integrated approach, where the regional model is used to predict the exchange fluxes between the Condamine Alluvium and the Walloon Coal Measures. A zero recharge rate is assumed for the Condamine Alluvium in the regional model to ensure ‘consistency between the regional model and the Condamine Model (KCB, 2011)’ (GHD, 2012, p. 59). ‘Under this arrangement, modelled groundwater levels in the Condamine are insensitive to recharge’ (GHD, 2012, p. 59).
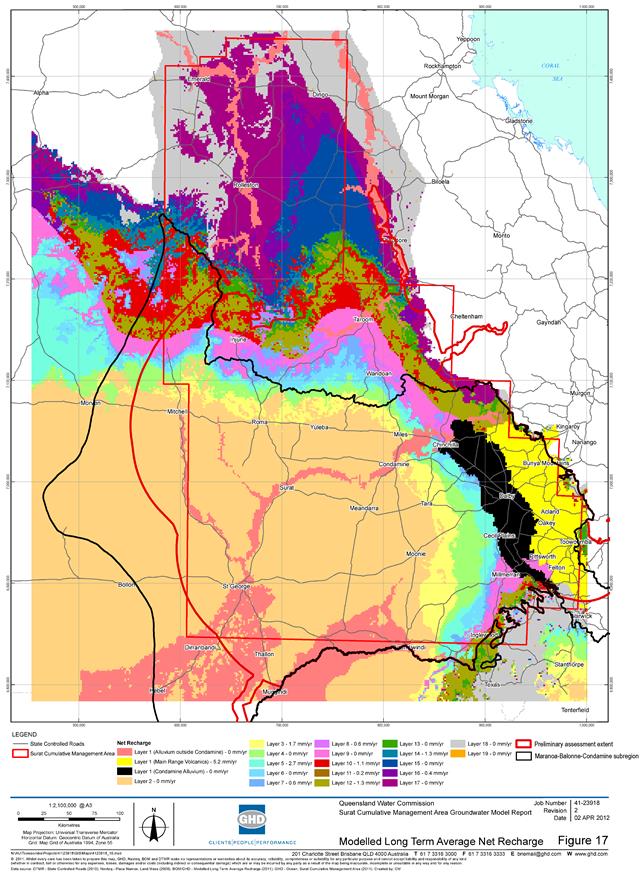
Net recharge is defined for the OGIA model as ‘Modelled water table recharge – modelled discharge to local shallow groundwater systems + net inflow from adjacent layers. Net recharge is therefore equivalent to the modelled flux to the deeper confined system. The difference between the two different modelled recharge values quoted therefore represents the proportion of potential or water table recharge that is rejected via shallow groundwater systems and/or surface water courses’ (GHD, 2012, p. 60). Calibrated net recharge values used in the OGIA model are shown in Table 4 and Figure 8.
Table 4 Initial watertable recharge and calibrated net recharge values used in the Office of Groundwater Impact Assessment (OGIA) model
na = not applicable
Source: Table 11 Initial Values and Permissible Ranges – Water Table Recharge and Table 17 Calibrated Values – Recharge (GHD, 2012)
Source: adapted from Figure 17 Modelled Long Term Average Net Recharge (GHD, 2012)

Product Finalisation date
- 2.6.2.1 Methods
- 2.6.2.2 Review of existing models
- 2.6.2.3 Model development
- 2.6.2.4 Boundary and initial conditions
- 2.6.2.5 Implementation of coal resource development pathway
- 2.6.2.6 Parameterisation
- 2.6.2.7 Observations and predictions
- 2.6.2.8 Uncertainty analysis
- 2.6.2.9 Limitations
- Glossary
- Citation
- Acknowledgements
- Contributors to the Technical Programme
- About this technical product

