The long-term average recharge was estimated using chloride mass balance (Anderson, 1945) and empirical relationships based on annual rainfall, soil clay content and vegetation type as described in companion product 2.1-2.2 for the Clarence-Moreton bioregion (Raiber et al., 2016a). The estimated point-scale recharge was upscaled using annual average rainfall as a covariate to yield a continuous surface that represents recharge (Crosbie et al., 2015). The upscaled recharge surface was then assigned to the first stress period (steady state) of the groundwater model using the MODFLOW Recharge package (Harbaugh, 2005).
The upscaled estimates of recharge derived from the chloride mass balance method only provide a long-term average rate. In order to obtain a transient recharge boundary, a temporal sequence of recharge was generated by the Australian Water Resources Assessment (AWRA) landscape model (AWRA-L) (Hafeez et al., 2015), which is able to reproduce the temporal trends of groundwater recharge when compared to time series field data in a limited number of locations. However, it cannot reproduce the spatial heterogeneity in long-term average recharge at the local scale (Shi et al., 2015). Hence, the AWRA-L outputs were normalised to generate a time series of recharge change (Figure 13), which was then used to scale the upscaled long-term average recharge derived from the chloride mass balance analysis into a spatially explicit time series of recharge. The adjustment of recharge during the sensitivity and uncertainty analysis was implemented using nine multipliers (Table 4) that correspond to various surface hydrogeological units as shown in Figure 8 in the Section 2.6.2.3. The Walloon Coal Measures outcrop areas are represented in the model by three recharge zones because they are located in different parts of the Richmond river basin where the hydrological characteristics (e.g. topography or rainfall) are very diverse. This three-zone representation also increases the flexibility of constraining the numerical model during the uncertainty analysis.
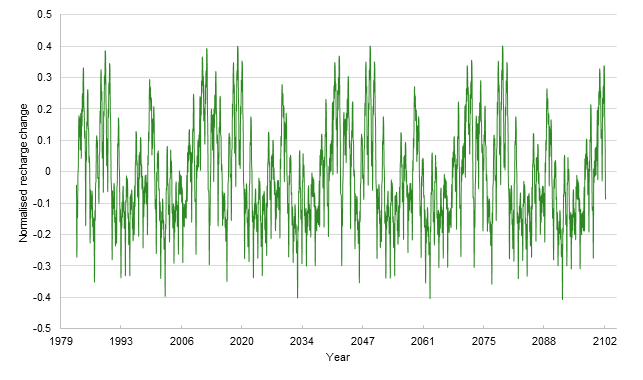
Figure 13 Normalised recharge change in the groundwater model domain
Data: Bioregional Assessment Programme (Dataset 1)
