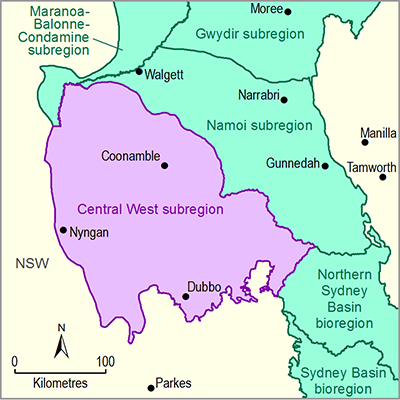
The Macquarie-Castlereagh river basin contributes about 8.4% of total runoff and uses slightly less than 4% of the surface water diverted for irrigation in the Murray–Darling Basin. The mean annual rainfall in the subregion is about 520 mm (1900 to 2011; see Section 1.1.2.1). Rainfall is slightly higher during January and February but is fairly uniform for the rest of the year. The mean annual modelled runoff is 35 mm (1985 to 2006) for whole of the Macquarie-Castlereagh river basin and is reasonably uniform throughout the year (CSIRO, 2008). The indicative runoff ratio based on mean annual rainfall and runoff is 6.7%. The mean annual modelled runoff over the ten-year period 1997 to 2006 is 33 mm, slightly lower than the long-term runoff value.
Sixty-three stream gauging stations in the Macquarie river basin, including six on the Bogan River and eight in the Castlereagh river basin, are still operational. These stations are managed by the NSW Office of Water and the majority of the stations are telemetered. The record lengths vary from a few years to more than 100 years. Summary statistics from some of the streamflow gauging stations in the Macquarie and Castlereagh river basins are given in Table 16 . Full details can be found in NSW Government (2013).
The impact of climate change by the South Eastern Australian Climate Initiative (SEACI) for the whole Macquarie-Castlereagh river basin indicated that 12 of 15 GCMs projected a decrease in future runoff showing a median reduction of 8% and 12% under 1°C and 2°C global warming, respectively (Post et al., 2012). See Section 1.1.2.3(Climate) for further details. The CSIRO (2008) study also indicated the effect of projected climate change on future runoff in the whole of the Macquarie-Castlereagh river basin is a likely decrease of runoff of about 6% for 2030 climate based on the median estimate.
Table 16 Selected open stream gauging stations in the Macquarie, Castlereagh and Bogan river basins within the Central West subregion and summary statistics
a The catchment areas and flow values are taken from the source given in the caption. There are inconsistencies in their values at different locations along the Macquarie River.
Source data: NSW Government (2013)

