- Home
- Assessments
- Bioregional Assessment Program
- Galilee subregion
- 2.7 Receptor impact modelling for the Galilee subregion
- 2.7.4 Streams landscape groups
- 2.7.4.2 Qualitative mathematical model
At the qualitative modelling workshop, separate modelling efforts were initially conducted for both temporary and permanent stream systems, but after completion of a model for temporary streams in a flowing state it was concluded that the essential dynamics of both systems could be addressed by the same model. Therefore, the ‘Streams, GDE’ and ‘Streams, non-GDE’ landscape groups were combined within a single qualitative mathematical model.
An ecologically important feature of temporary streams is the existence and connectivity of refuge habitats (e.g. Sheldon et al., 2010; Robson et al., 2011). In seasons or years where stream reaches are dry, isolated pools and springs within the floodplain may persist depending on factors that control their depth and persistence. Populations of aquatic primary producers, invertebrates and vertebrates within these refuge habitats serve as a critical source of propagules that, following high rainfall events that reconnect the stream channel with flowing surface water, can fuel a ‘mini-boom’ state for the stream ecosystem (Arthington et al., 2010; Arthington and Balcombe, 2011; Kerezsy et al., 2011). Once isolated pools and springs (non-flowing temporary stream) have been transformed into a flowing stream with a fully functioning stream ecosystem, it was considered that its basic ecological features are functionally the same as those for permanent stream systems.
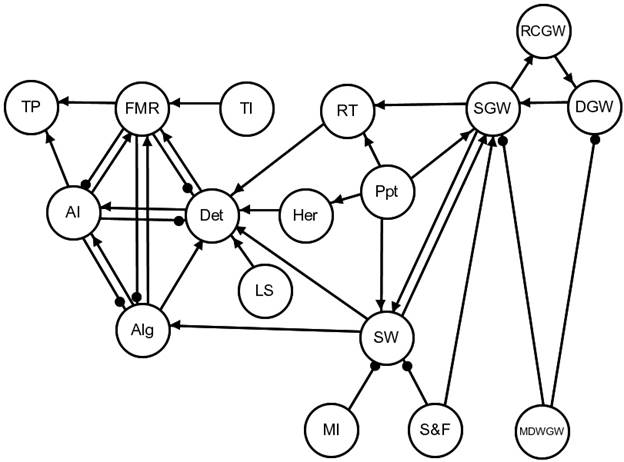
In the model for temporary streams (in a flowing state) and permanent streams, surface water serves a key role in providing both lateral and downstream transport of detritus in the stream channel and floodplain. It also determines, through wetted area of the channel, the amount of primary production generated by algae. Detritus and algae function as the principal resources that support populations of aquatic invertebrates and fishes (Blanchette, 2012; Guo et al., 2016). Surface water also plays a key role in recharging stores of deep groundwater in confined aquifers, and in turn, stores of deep groundwater can contribute to shallow groundwater. Potential impacts from mining operations include direct interception of precipitation, draining or capture of surface water through subsidence and fracturing of the surface, and dewatering of shallow and deep aquifers. An uncertain link in the model was the degree to which stores of near-surface or shallow groundwater could contribute to surface water that enters the stream channel. This led to the development of two alternative models, one with (Figure 20) and one without (Figure 21) a link from shallow groundwater to surface water.
Model variables are: aquatic invertebrates (AI), algae (Alg), detritus within stream channel (Det), deep groundwater (confined aquifers) (DGW), fishes (migrant and refugial populations) (FMR), herbs (Her), lateral stores of detritus (LS), mine dewatering of ground water (MDWGW), mine interception (MI), precipitation (Ppt), recharge of confined groundwater (RCGW), riparian trees (RT), subsidence and fracturing from mining (S & F), shallow groundwater (SGW), surface water (SW), terrestrial invertebrates (TI), terrestrial predators (TP).
Data: Bioregional Assessment Programme (Dataset 4)
Model variables are: aquatic invertebrates (AI), algae (Alg), detritus within stream channel (Det), deep groundwater (confined aquifers) (DGW), fishes (migrant and refugial populations) (FMR), herbs (Her), lateral stores of detritus (LS), mine dewatering of ground water (MDWGW), mine interception (MI), precipitation (Ppt), recharge of confined groundwater (RCGW), riparian trees (RT), subsidence and fracturing from mining (S&F), shallow groundwater (SGW), surface water (SW), terrestrial invertebrates (TI), terrestrial predators (TP).
Data: Bioregional Assessment Programme (Dataset 4)
At the qualitative modelling workshop there was discussion about the importance of pool refugia and connectedness among pools by floods/pulses, and how this relates to higher trophic level organisms such as fish. At the same time, it was recognised that pool refugia would be a difficult receptor impact variable target for ecologists as it requires knowledge of depth of channel and related factors. It is arguably closer to a hydrology question than an ecology question, as pointed out by some of the expert commentary. For that reason, discussion at the workshop led to the development of a Galilee subregion streams qualitative model that identifies algae as a basal resource variable. This is in turn linked to the surface water regime as mediated through wetted area, not only of pools but also reaches and other stream components. For example, wetted area and hence algae may have a predictable relationship with no-flow days in the streams landscape groups.
Conceptual, surface water and groundwater modelling for the Galilee subregion indicated that potential impacts may occur from mine interception of rainfall, subsidence and fracturing from mining and aquifer dewatering adjacent to mines. Based on all possible combinations of these potential impacts, a total of seven cumulative impact scenarios were developed for qualitative analyses of response predictions (Table 11).
Table 11 Summary of the cumulative impact scenarios (CISs) for the streams landscape groups in the Galilee subregion zone of potential hydrological change
|
CIS |
MI |
S&F |
MDWGW |
|---|---|---|---|
|
C1 |
+ |
0 |
0 |
|
C2 |
0 |
+ |
0 |
|
C3 |
0 |
0 |
+ |
|
C4 |
+ |
+ |
0 |
|
C5 |
+ |
0 |
+ |
|
C6 |
0 |
+ |
+ |
|
C7 |
+ |
+ |
+ |
Pressure scenarios are determined by combinations of no-change (0) or an increase (+) in the following signed digraph variables: mine interception (MI), subsidence and fracturing from mining (S&F), and mine dewatering of groundwater (MDWGW).
Data: Bioregional Assessment Programme (Dataset 4)
Qualitative analysis of the signed digraph models in Figure 20 and Figure 21 generally indicates a zero, ambiguous or negative response prediction for all biological variables within the ecosystem associated with the streams landscape groups as a result of mine interception (e.g. of rainfall or overland flow), subsidence and fracturing, and mine dewatering (Table 12 and Table 13, respectively). The only variable that had a positive response prediction was algae for Model 1 as a result of impacts from mine dewatering of groundwater under cumulative impact scenario 3 (increased mine dewatering of groundwater (MDWGW), no changes related to other variables). For Model 2, which omitted the link of replenishment of surface water from shallow groundwater, there was less ambiguity for the response of fish, with negative response predictions across all scenarios except for a stand-alone impact from subsidence and fracturing (cumulative impact scenario C2, Table 13) for fish.
Table 12 Predicted response of the signed digraph stream and riparian variables (Model 1) in the streams landscape groups to (cumulative) changes in hydrological response variables
Qualitative model predictions that are completely determined are shown without parentheses. Predictions that are ambiguous but with a high probability (0.80 or greater) of sign determinacy are shown with parentheses. Predictions with a low probability (less than 0.80) of sign determinacy are denoted by a question mark. Zero denotes completely determined predictions of no change.
Data: Bioregional Assessment Programme (Dataset 4)
Table 13 Predicted response of the signed digraph variables (Model 2) of the stream and riparian variables in the streams landscape groups to (cumulative) changes in hydrological response variables
Qualitative model predictions that are completely determined are shown without parentheses. Predictions that are ambiguous but with a high probability (0.80 or greater) of sign determinacy are shown with parentheses. Predictions with a low probability (less than 0.80) of sign determinacy are denoted by a question mark. Zero denotes completely determined predictions of no change.
Data: Bioregional Assessment Programme (Dataset 4)

Product Finalisation date
- 2.7.1 Methods
- 2.7.2 Overview
- 2.7.2.1 Introduction
- 2.7.2.2 Potentially impacted landscape groups
- 2.7.2.3 'Springs' landscape group
- 2.7.2.4 Streams landscape groups
- 2.7.2.5 'Floodplain, terrestrial GDE' landscape group
- 2.7.2.6 'Non-floodplain, terrestrial GDE' landscape group
- 2.7.2.7 Outline of content in the following landscape group sections
- References
- Datasets
- 2.7.3 'Springs' landscape group
- 2.7.4 Streams landscape groups
- 2.7.5 'Floodplain, terrestrial groundwater-dependent ecosystem' landscape group
- 2.7.6 'Non-floodplain, terrestrial groundwater-dependent ecosystem' landscape group
- 2.7.7 Limitations and gaps
- Citation
- Acknowledgements
- Contributors to the Technical Programme
- About this technical product


