In developing a future series of climate input, the objective is to choose the set of global climate model (GCM) seasonal scaling factors that give the median change in mean annual precipitation in the Namoi subregion. There are 15 available GCMs (as presented in Table 6) with seasonal scaling factors for each of the four seasons: summer (December–February), autumn (March–May), winter (June–August) and spring (September–November).
For each GCM the change in mean seasonal precipitation that is associated with a 1 °C global warming is calculated. These seasonal changes are then summed to give a change in mean annual precipitation. The resulting changes in mean annual precipitation for a 1 °C global warming in the Namoi subregion are shown in Table 6 for each GCM. The 15 GCMs predict changes in mean annual precipitation ranging from +8.3% (i.e. an increase in mean annual precipitation) to –6.5%. The GCM with median change is IAP from the Institute of Atmospheric Physics, China. The corresponding projected change in mean annual precipitation per degree of global warming is a reduction of 1.9%, or about 10 mm. The seasonal scaling factors for IAP are +0.27%, –4.32%, –3.87% and –0.49% for summer, autumn, winter and spring, respectively. In other words, projected increases in precipitation in the wettest season, summer, are offset by projected decreases in the other three seasons.
Table 6 List of 15 global climate models and their predicted change in mean annual precipitation for the Namoi subregion per degree of global warming
Data: Bioregional Assessment Programme (Dataset 4)
The seasonal scaling factors associated with IAP are used to generate trended climate inputs for the years 2013 to 2102. The trends assume global warming of 1 °C for the period 2013 to 2042, compared to 1983 to 2012. The global warming for 2043 to 2072 is assumed to be 1.5 °C and the corresponding scaling factors for this period are therefore multiplied by 1.5. The global warming for 2073 to 2102 is assumed to be 2 °C.
The scaling factors are applied to scale the daily precipitation in the climate input series that is generated for 2013 to 2102. The resulting annual precipitation time series for the Namoi subregion is shown in Figure 6. It depicts a 30-year cycle of 1983 to 2012 climate that is repeated a further three times but with increasingly trended climate change scalars.
In order to create the 90 years of climate inputs needed for the modelling, the last 30 years (1983-2012) of climate data were repeated 3 times with a climate change signal added on top of it. While this misses some of the extremes of historical variability, this will not affect the results since the timing of the coal resource developments would need to align exactly with an extreme year in order for its impacts to be felt. Also, as the difference between two futures each with exactly the same climate inputs is considered, any differences will largely cancel out. Finally, a 30 year repeating sequence was needed in order to assess ecological impacts since they are assessed over 30 year periods, and a climate sequence which differed between periods would make it impossible to disentangle the impacts of coal resource development from the impacts of climate variability.
Figure 6 shows that the decrease in precipitation from 2013 to 2102 is less than the typical inter-annual variability. Furthermore, it reduces average annual precipitation to levels that remain much higher than were typically encountered before the 1950s. Potential evaporation data from the 30‑year cycle of 1983 to 2012 was repeated without scaling to generate potential evaporation for 2013 to 2102.
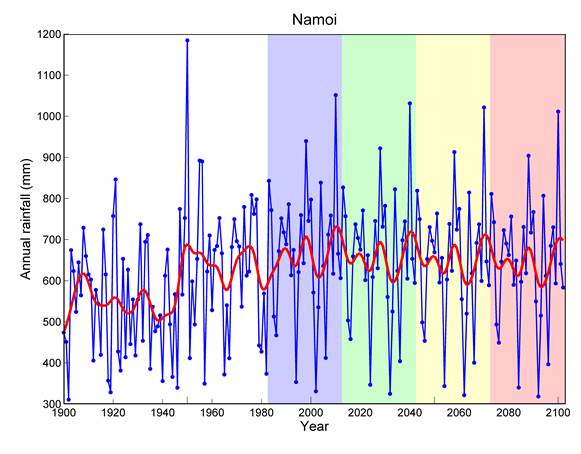
The blue line shows the time series. The red line is a 23-year centrally weighted moving average. The colour bands show each 30 year prediction periods.
Data: Bioregional Assessment Programme (Dataset 5)
