There are a number of jurisdictional boundaries used in this context statement, including (i) LLS regions (NSW Government, 2014), (ii) Interim Biogeographic Regionalisation for Australia (IBRA) bioregions and subregions (SEWPaC, 2012) and (iii) NSW local government areas (LGAs) (Australian Bureau of Statistics, 2011). Their relationships with the Hunter subregion are characterised below.
The Hunter subregion contains parts of five LLS regions (NSW Government, 2014) (Table 3 and Figure 5). Over 80% of the Hunter subregion is composed of the Hunter LLS region, with most of the remaining subregion area being accounted for by the Central Tablelands and Greater Sydney LLS regions, covering approximately 13 and 6.5% respectively (Table 3 and Figure 5).
Table 3 Local land services regions contained in the Hunter subregion
These data are in descending order based on the ‘Percentage of LLS in Hunter subregion’ column.
aLocal land services region
Data: NSW Trade and Investment (Dataset 3)
The Hunter subregion contains parts of 13 IBRA subregions (SEWPaC, 2012) (Figure 6 and Table 4). There are three IBRA subregions that are essentially wholly contained (i.e. >90%) in the Hunter subregion: Wyong, Hunter and Kerrabee. Almost 60% of the Liverpool Range IBRA subregion and 30% of the Yengo IBRA subregion are contained in the Hunter subregion. The names and relevant statistics for the eight remaining IBRA subregions contained within the Hunter subregion are provided in Table 4.
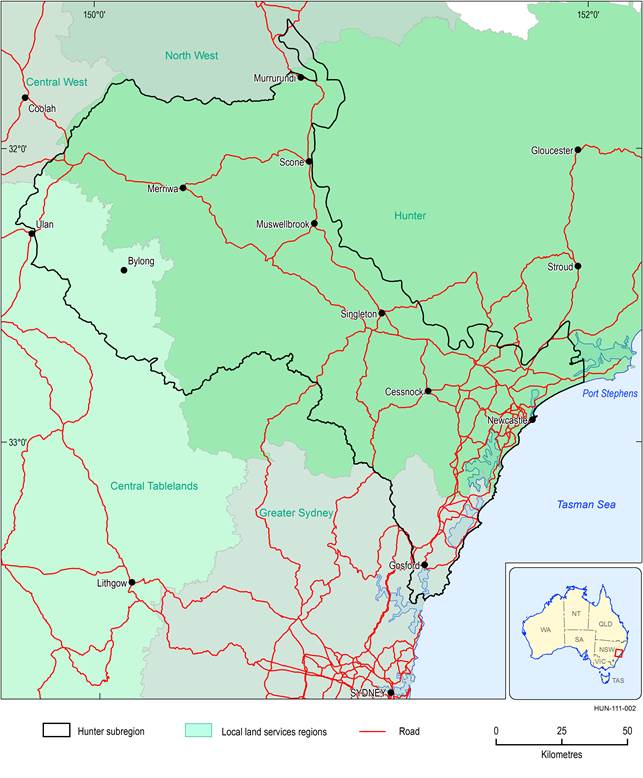
Figure 5 Local land services regions relative to the Hunter subregion
Data: NSW Trade and Investment (Dataset 3)
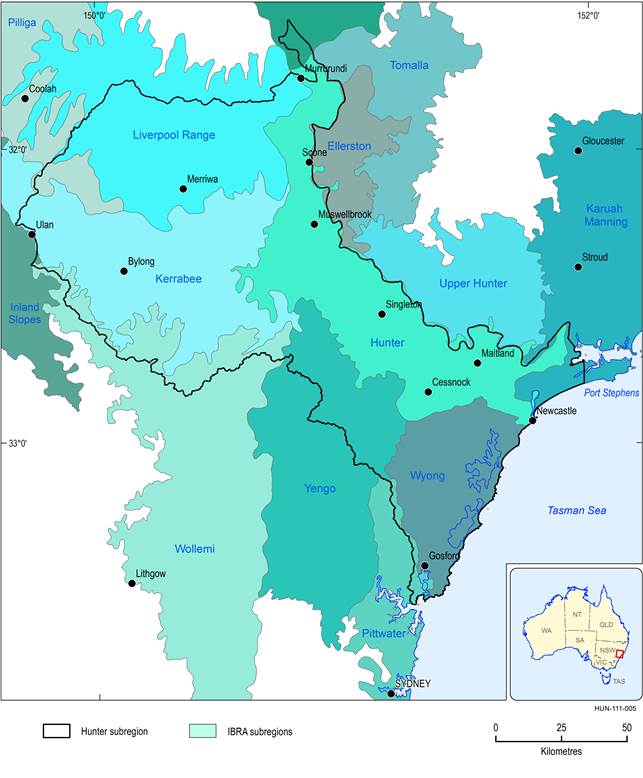
Data: SEWPaC (Dataset 4)
Table 4 Interim Biogeographic Regionalisation for Australia (IBRA) subregions contained in the Hunter subregion
These data are in descending order based on the ‘Percentage of IBRA subregion in Hunter subregion’ column.
Data: SEWPaC (Dataset 4)
aThere are four main IBRA bioregions within the Hunter subregion, each represented by the alpha part of the IBRA subregion code: (i) SYB – Sydney Basin, (ii) BBS – the Brigalow Belt South, (iii) NNC – NSW North Coast and (iv) NAN – Nandewar.
The Hunter subregion contains parts of 16 NSW LGAs (Australian Bureau of Statistics, 2011) (Figure 7 and Table 5). There are three LGAs that are essentially wholly contained (i.e. >99%) in the Hunter subregion: Wyong, Lake Macquarie and Newcastle. Then in descending order of percentage of the LGA in the subregion there is Muswellbrook (92%), Maitland, Cessnock, Port Stephens, Upper Hunter Shire, Singleton (49%), with approximately a quarter of the Gosford and Mid-Western Regional LGAs also being included in the Hunter subregion. The remaining LGAs (i.e. Liverpool Plains, Dungog, Great Lakes, Warrumbungle Shire and Hawkesbury) each contribute less than 2% of the Hunter subregion.
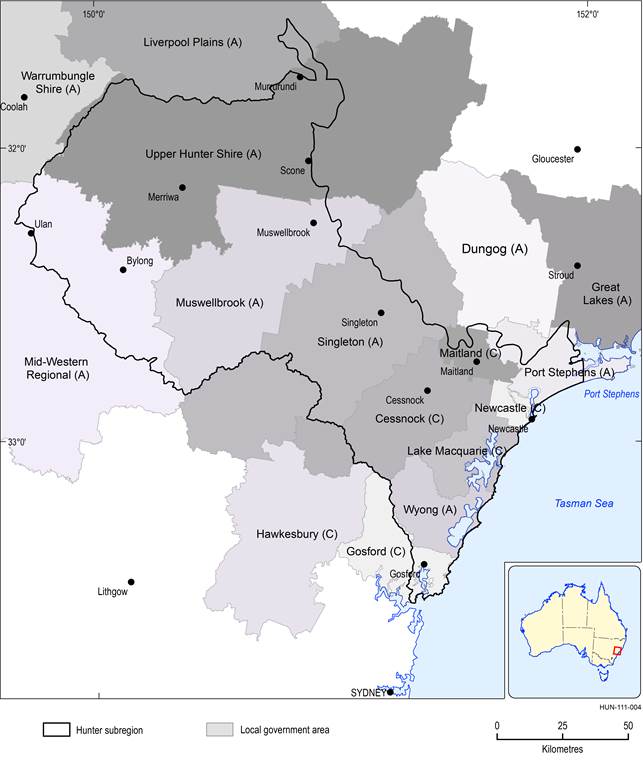
Figure 7 Local government areas relative to the Hunter subregion
Data: ABS (Dataset 5)
Table 5 Local government areas (LGAs) contained in the Hunter subregion
These data are in descending order based on the ‘Percentage of LGA in Hunter subregion’ column.
aLGA names are as they appear in the database – (A) = area (i.e. shire) council; (C) = city council
Data: ABS (Dataset 5)
The combined LGA area is approximately 23,965 ha smaller than the Hunter subregion area because a number of water bodies are not included in the spatial definitions of the LGAs. Denoted as ‘name (associated LGA) and area (ha)’, these are: (i) Lake Macquarie (Lake Macquarie) 10,897 ha, (ii) Tuggerah Lake (Wyong) 5865 ha, (iii) Brisbane Water (Gosford) 2449 ha, (iv) Budgewoi Lake (Wyong) 1369 ha, (v) Lake Munmorah (Wyong) 785 ha and (vi) Newcastle Harbour (i.e. Fullarton Cove/Hunter River) 2600 ha.
