Breadcrumb
		Page 33 of 41	
  The medians of absolute maximum change in Figure 17 indicate that the LLFS across the region is to increase by up to 8 days. As for the changes in LFS and LFD, this occurs at the downstream nodes of Shannon Brook.
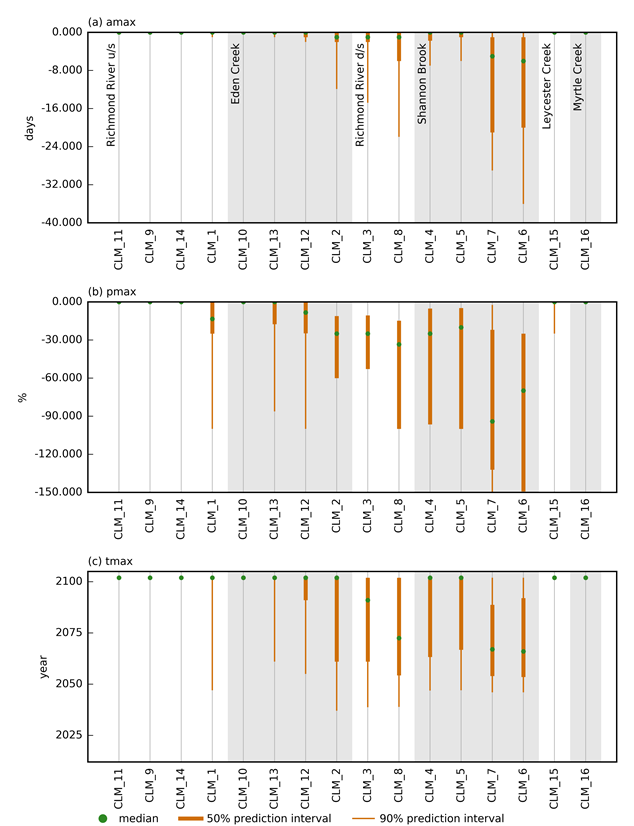
d/s = downstream of; u/s = upstream of
The circle indicates the median of the posterior predictive distribution, the length of the thick vertical line spans the interquartile range (or 50th percentile prediction interval), and the thin vertical line spans the 90th percentile prediction interval. Nodes are grouped per catchment, ordered from upstream to downstream.
Data: Bioregional Assessment Programme (Dataset 2)


	    					Last updated: 				    


	    18 October 2018	  


	    					Summary and download				    


	  	Product Finalisation date
	    					2016						


	    					PRODUCT CONTENTS				    


	  - 2.6.1.1 Methods
 - 2.6.1.2 Review of existing models
 - 2.6.1.3 Model development
 - 2.6.1.4 Calibration
 - 2.6.1.5 Uncertainty
 - 2.6.1.6 Prediction
- 2.6.1.6.1 Annual flow (AF)
 - 2.6.1.6.2 Interquartile range (IQR)
 - 2.6.1.6.3 Daily streamflow at the 99th percentile (P99)
 - 2.6.1.6.4 Flood (high-flow) days (FD)
 - 2.6.1.6.5 Daily streamflow at the 1st percentile (P01)
 - 2.6.1.6.6 Low-flow days (LFD)
 - 2.6.1.6.7 Low-flow spells (LFS)
 - 2.6.1.6.8 Longest low-flow spell (LLFS)
 - 2.6.1.6.9 Zero-flow days (ZFD)
 - 2.6.1.6.10 Summary and conclusions
 - References
 - Datasets
 
 - Citation
 - Contributors to the Technical Programme
 - Acknowledgements
 - About this technical product
 
ASSESSMENT
	    					ASSESSMENT COMPONENT				    


						