Figure 10 shows very small declines in AF, with median changes not in excess of 0.01 GL/y. The largest predicted range of change is at model nodes CLM_003 and CLM_008, which are the main channel of the Richmond River itself. The 95th percentile of change in AF does not exceed 0.1 GL/y. In percentage terms, the 95th percentile of reduction in AF is less than 0.1% for all nodes. For the nodes where the median absolute change in AF is not zero, the median of the year of maximum change is between 2055 and 2065.
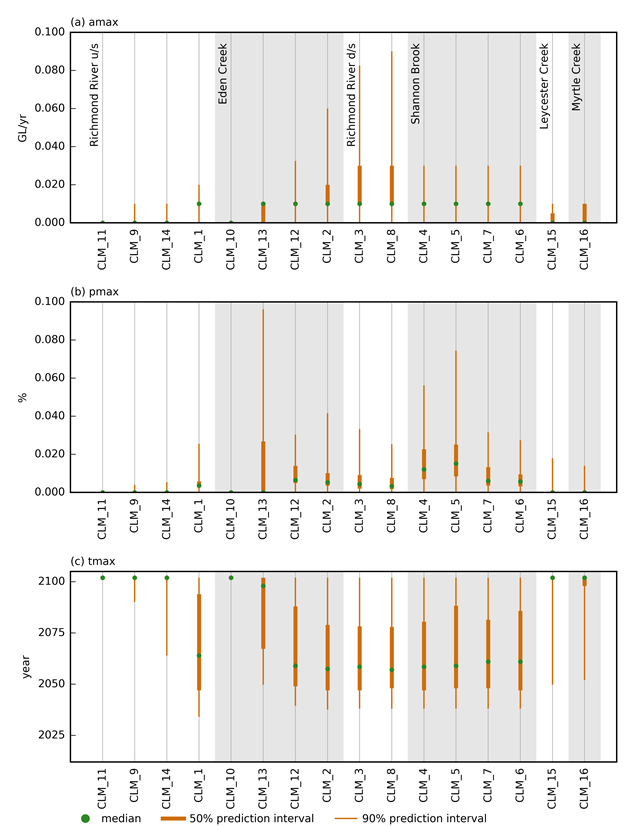
d/s = downstream of; u/s = upstream of
The circle indicates the median of the posterior predictive distribution, the length of the thick vertical line spans the interquartile range (or 50th percentile prediction interval), and the thin vertical line spans the 90th percentile prediction interval. Nodes are grouped per catchment, ordered from upstream to downstream.
Data: Bioregional Assessment Programme (Dataset 2)
