Figure 15 shows that the number of LFD (the number of days per year the flow is less than the long-term 10th percentile of flow) increases in several of the catchments that overlap the CRDP in its contribution area, and that the median increase is generally between zero and 20 days. This would de facto mean that low-flow conditions increase up to 3 weeks per year.
This relatively large change is partly an artefact of the way the hydrological response variable is defined. For days in the future with a streamflow that is equal to or slightly above the long-term 10th percentile of flow, a very small change in streamflow may often be sufficient to cause the daily flow event to be classified as a LFD. As it generally is very likely to have several days in succession with low flow, small changes in streamflow can cause large changes in LFD as formally defined in this hydrological response variable.
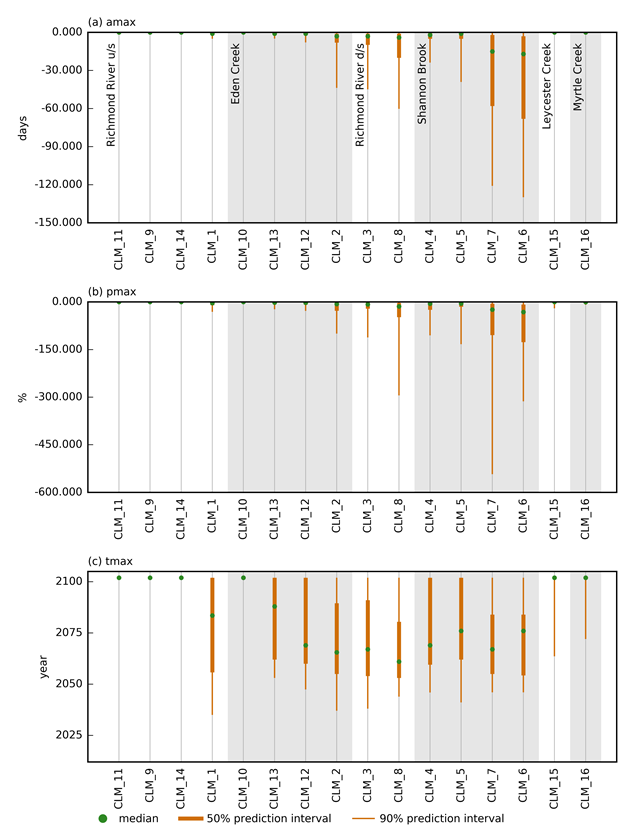
d/s = downstream of; u/s = upstream of
The circle indicates the median of the posterior predictive distribution, the length of the thick vertical line spans the interquartile range (or 50th percentile prediction interval), and the thin vertical line spans the 90th percentile prediction interval. Nodes are grouped per catchment, ordered from upstream to downstream.
Data: Bioregional Assessment Programme (Dataset 2)
