The water resources in the surface water and groundwater systems are managed through water sharing plans in NSW. Water sharing plans are subordinate legislation under NSW’s Water Management Act 2000. Table 40 lists the groundwater sources within the Namoi subregion that are covered by the six water sharing plans. Each water sharing plan specifies the water sources to which it applies.
Groundwater management in the Namoi subregion is undertaken through six water sharing plans of the NSW Government. These plans lie wholly or partially within the subregion. Figure 14 of companion product 1.5 for the Namoi subregion (Peña-Arancibia et al., 2016) shows the extent and overlap of the water sharing plan areas within the Namoi subregion. There are 22 groundwater sources defined by the NSW Government covered by these six water sharing plans in accordance with the Commonwealth’s Basin Plan 2012 (the Basin Plan) and 21 of those are within the Namoi subregion (Table 40) and there are 31 groundwater sources within the assessment extent. Two of these sources, the Surat and Southern Recharge groundwater sources, are not considered to be part of the Murray–Darling Basin.
Additional coal resource development can impact the economic assets when and where changes in groundwater and surface water hydrology increase the cost of water supply and access. The assessment of potential impact does not involve estimates of costs in monetary terms; instead economic assets within the zone of potential hydrological change are identified and the likelihood of changes to water access are assessed. Economic assets include the water resources themselves, the water supply works, which enable users to access water under a water access licence, or a basic water right.
Table 40 Groundwater management areas within the Namoi subregion
aDescriptions come from Schedule 4 of the Commonwealth’s Basin Plan 2012 except for the Surat and Southern Recharge groundwater sources.
bDescriptions of the Surat and Southern Recharge groundwater sources come from the Water Sharing Plan for the NSW Great Artesian Basin Groundwater Sources (NSW Government, 2008).
MDB = Murray–Darling Basin
Source: companion product 1.5 for the Namoi subregion (Peña-Arancibia et al., 2016)
3.5.3.1 Assets in the zone of potential hydrological change
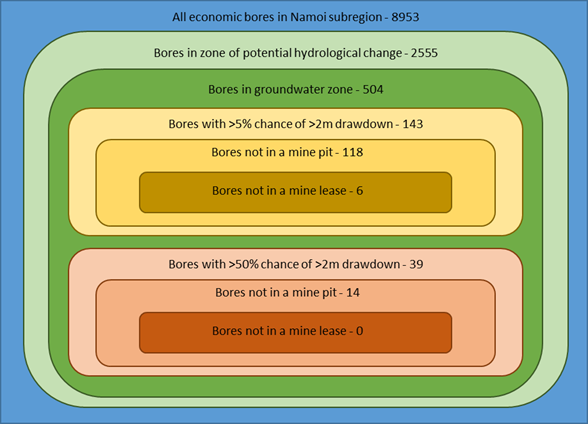
The water-dependent asset register for the Namoi subregion (O’Grady et al., 2015; Bioregional Assessment Programme, 2017; Bioregional Assessment Programme, Dataset 2) has 168 economic water-dependent assets comprising 10,418 elements; however, there are 39 economic assets in the zone of potential hydrological change within the surface water management zone. There are 80 economic assets in the assessment extent that are in the ‘Groundwater management zone or area’ economic asset subgroup comprising 8953 groundwater access entitlements (Table 41).
Table 41 Economic assets and elements in the Namoi assessment extent, zone of potential hydrological change and mine pit exclusion zone
Data: Bioregional Assessment Programme (Dataset 1, Dataset 2)
Figure 46 identifies the groundwater sources and bores and extraction points that intersect the zone of potential hydrological change, and hence are potentially impacted due to additional coal resource development. Table 42 lists the potentially impacted groundwater sources and the number of water rights holders (both access licence and basic rights) within the zone of potential hydrological change. Of the 31 groundwater sources in the Namoi assessment extent, there are 17 that have bores within the zone of potential hydrological change but only 9 that have bores within the groundwater zone of potential hydrological change. These nine groundwater sources (Gunnedah-Oxley Basin MDB, Lower Namoi, Peel Alluvium, Southern Recharge and Upper Namoi zones 3, 4, 5, 7 and 8) are potentially impacted due to additional coal resource development, whereas the other 22 groundwater sources are very unlikely to be impacted due to additional coal resource development.
Of the 2555 bores identified as being within the zone of potential hydrological change there are only 504 within the groundwater zone of potential hydrological change and are therefore potentially impacted (excluding the 25 bores within the mine pit exclusion zone) (Table 41 and Table 42). It is very unlikely that the 2051 bores solely within the surface water zone of potential hydrological change will be impacted due to additional coal resource development.
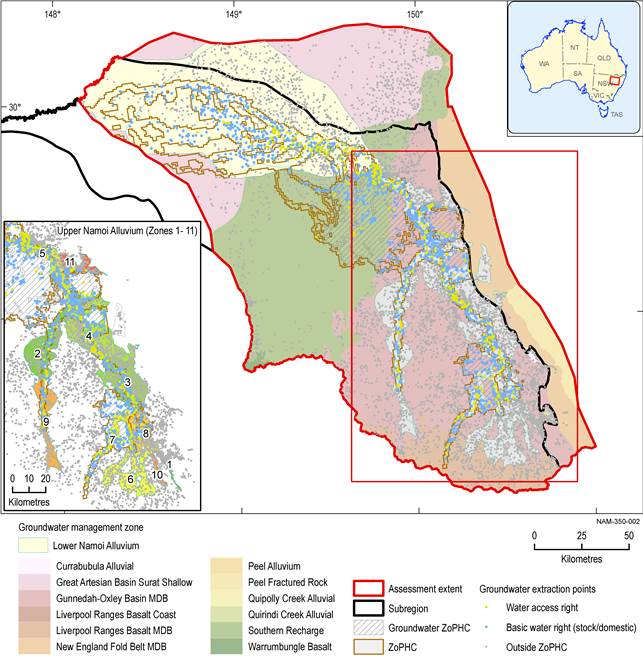
Figure 46 Groundwater source areas and bores in the zone of potential hydrological change
MDB = Murray–Darling Basin, ZoPHC = zone of potential hydrological change
Data: Bioregional Assessment Programme (Dataset 1)
Table 42 Number of bores in the assessment extent, zone of potential hydrological change, groundwater zone of potential hydrological change and in mine pit exclusion zone
GAB = Great Artesian Basin, GW = groundwater, MDB = Murray-Darling Basin
Data: Bioregional Assessment Programme (Dataset 1)
3.5.3.2 Bores where drawdown is greater than the minimum impact consideration
Environmental provisions relating to extractions from aquifers are intended to protect the long‑term storage component of the aquifer. Extractions are based on reserving a proportion of recharge for the environment. Cease-to-pump rules are used to restrict pumping when levels drop below some specified level or water quality is deteriorating. The NSW Aquifer Interference Policy (NSW Office of Water, 2012), which was introduced in September 2012, is intended to protect groundwater resources from activities that potentially interfere with them. It requires that all water extracted from an aquifer must be accounted for, that the activity must address minimal impact considerations and planning must make provision for situations where actual impacts are greater than predicted.
Minimal impact thresholds are specified for highly productive and less productive groundwater sources and different aquifer types (alluvial, coastal sands, porous rock and fractured rock), but can generally be defined as less than 10% cumulative variation in watertable level, 40 m from any high-priority groundwater-dependent ecosystem (GDE) or culturally significant site, with a maximum decline of 2 m at any water supply work.
Table 43 lists the water sources that have bores within the zone of potential hydrological change with a greater than 5%, 50% and 95% chance of drawdowns exceeding 2 m due to additional coal resource development. Excluding the 25 bores within the mine pit exclusion zone, there are 118 bores with greater than 5% chance of exceeding 2 m additional drawdown, 14 bores with greater than 50% chance and 1 bore with greater than 95% chance of exceeding 2 m drawdown due to additional coal resource development. Of these 118 bores that may exceed the minimum impact threshold, at least 50 are owned by the mining companies (only Shenhua and Whitehaven provided information). The locations of these bores are shown in Figure 48 and a graphical representation is shown in Figure 47.
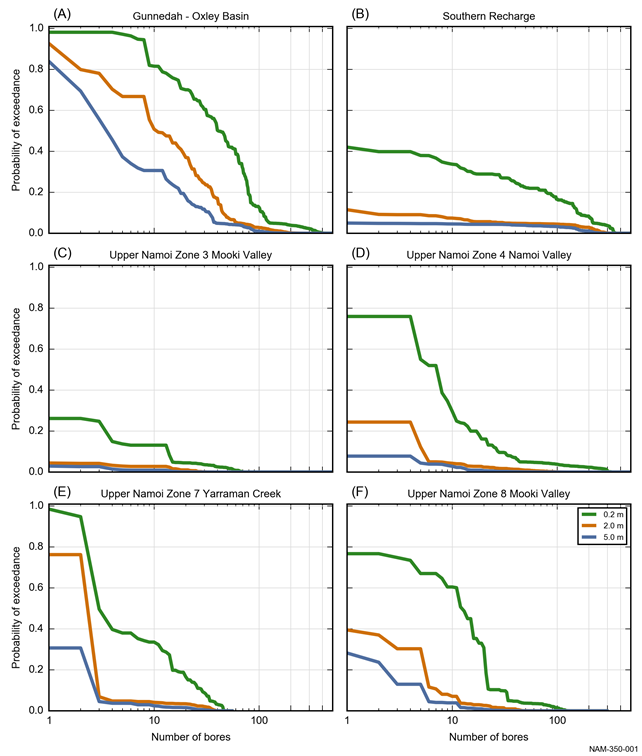
Of the nine groundwater sources that have bores within the zone of potential hydrological change there are seven that have bores with a greater than 5% chance of more than 2 m drawdown (Gunnedah-Oxley Basin MDB, Peel Alluvium, Southern Recharge and Upper Namoi zones 3, 4, 7 and 8). A cumulative distribution of the probability of exceeding 0.2, 2 and 5 m additional drawdown for each bore within these groundwater sources is shown in Figure 49 (the Peel Alluvium is not shown as it only has one bore with greater than 5% chance of exceeding 2 m drawdown).
Table 43 Number of bores where additional drawdown has greater than 5%, 50% and 95% chance of exceeding 2 m
Additional drawdown is the maximum difference in drawdown (dmax) between the coal resource development pathway (CRDP) and baseline, due to additional coal resource development.
MDB = Murray-Darling Basin
Data: Bioregional Assessment Programme (Dataset 1)
Data: Bioregional Assessment Programme (Dataset 1)
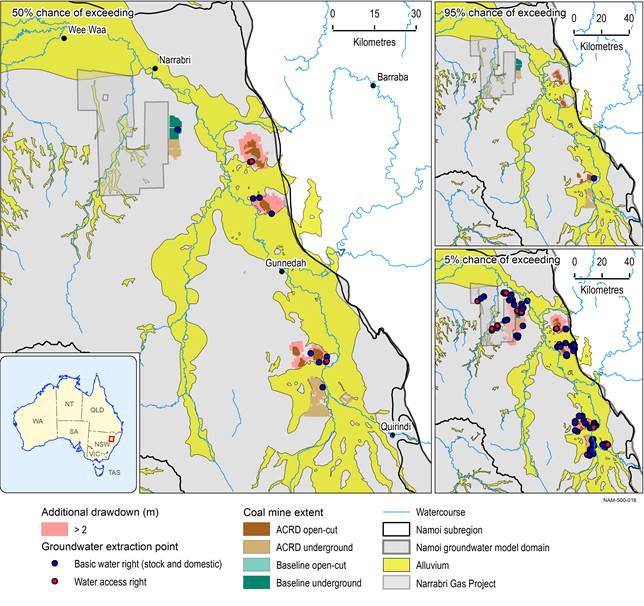
The open symbols are where the bore is located on a mine lease, the closed symbols are where the bore is located outside of a mine lease. Bores known to be owned by a mining company have been excluded from this figure. The extent of the coal resource developments in the coal resource development pathway (CRDP) is the union of the extents in the baseline and in the additional coal resource development (ACRD).
Data: Bioregional Assessment Programme (Dataset 1)
Additional drawdown is the maximum difference in drawdown (dmax) between the coal resource development pathway (CRDP) and baseline, due to additional coal resource development. Bores within the mine pits are not plotted on this figure.
Data: Bioregional Assessment Programme (Dataset 1)
3.5.3.3 Impact on surface water availability
The change in annual flow (AF) is used here as an indicator of changes in surface water availability due to additional coal resource development.
The Namoi Regulated River water source comprises the Upper Namoi and Lower Namoi sources. The maximum percentage changes in annual flow due to additional coal resource development in the Namoi Regulated River is less than 1% for all periods compared to the baseline period flow during 1983 to 2012. The modelling results indicate none of the modelling nodes in the Namoi Regulated River including the Pian Creek anabranch exceeded the specified threshold for average annual flows. The Namoi River and the Peel River networks, up to their confluence at Carrol Gap, also did not exceed specified thresholds since there were no coal mine or coal seam gas (CSG) developments affecting those river stretches.
Table 44 summarises changes in annual flows for Namoi unregulated water sources. The most downstream node for the water source including that for the Bohena Creek, Coxs Creek and Mooki River has been used to assess the change in water availability. Five of the water sources do not show any changes in any periods. No nodes on Baradine and Bohena creeks exceeded the specified threshold for average annual flows. The specified thresholds at upstream nodes of the Mooki River, Quirindi and Coxs creeks were also not exceeded for annual flow. The reductions in annual flows that occur for all unregulated rivers are relatively small compared to the baseline value. In nearly all of the cases, the changes are bigger for the longer-term period of 2073 to 2102. Even in the creeks, which are just downstream of mine sites (e.g. Merrygowen and Driggle Draggle), the effect of additional coal resource development on annual flow is almost negligible.
Table 44 Change in water availability (annual flow) due to the additional coal resource development for Namoi unregulated water sources in the zone of potential hydrological change
The average annual baseline flow for the short-term period (1983 to 2012, 95th percentile) is provided as context. Only the water sources with modelled nodes within the subregion are shown.
‘–‘ refers to ‘no change’
Data: Bioregional Assessment Programme (Dataset 3)
Unlike the Hunter subregion, the water sharing plans of the Lower Namoi Regulated River water source are not divided into different management zones. Table 45 summarises changes in annual flows for the Namoi Regulated River water source by reporting areas (see Section 3.3.2.2 in Section 3.3 for details on reporting areas). Nodes 32, 18, 14 and 1 are the downstream nodes of the Upper Namoi, Mid Namoi, Pilliga and Pilliga Outwash, and Lower Namoi reporting areas, respectively.
Table 45 Change in water availability (annual flow) due to additional coal resource development for reporting areas within the Namoi Regulated River water source
The average annual baseline flow for the short-term period (1983–2012, 95th percentile) is provided as context.
Data: Bioregional Assessment Programme (Dataset 1, Dataset 3)
3.5.3.4 Impact on surface water reliability
3.5.3.4.1 Regulated river
The Namoi Regulated River between the Split Rock Dam wall and the Barwon River, of which the river stretch upstream of the junction of Namoi and Peel rivers is out of the subregion, is unaffected by additional coal resource development in terms of changes in percent annual flow. Therefore, licence holders with entitlements to water from the Namoi River are unlikely to be potentially impacted.
3.5.3.4.2 Unregulated river
The unregulated rivers that are within the Namoi subregion include a range of rivers and creeks. Twenty-six nodes in the unregulated rivers are modelled. As Table 44 shows, of the modelled unregulated rivers, annual flow is not affected materially for any of these rivers. The maximum 95th percentile change in the annual flow in unregulated water sources is negligible (0.3%).
To maintain the low flows in the streams, the Namoi Unregulated River Water Sharing Plan imposes cease-to-pump rules requiring users to stop taking water when the streamflow declines below a set minimum flow. In many of the water sources the existing conditions on some licences are more restrictive than the cease-to-pump rules (DPI, 2016).
Table 46 lists the water sources within the zone of potential hydrological change that surface water modelling found to have an above-threshold change in the number of zero-flow days (ZFD) or low-flow days (LFD) due to additional coal resource development. The table also details the cease-to-pump rules for each water source and specifies the flow threshold used to quantify the impact on cease-to-pump days due to additional coal resource development. Where cease to pump is triggered by ‘no visible flow’, the change in the average number of zero-flow days in each 30-year period has been used to quantify the change. Where cease to pump is based on the flow rate falling below a specified flow rate at a reference location, then the change is assessed using the specified threshold. Where the cease-to-pump trigger has not been specified for a water source, the assessment has been based on the change in the average number of zero-flow days.
Table 46 Cease-to-pump rules for water sources in the surface water zone of potential hydrological change that surface water modelling found to have a change in zero-flow or low-flow days due to additional coal resource development greater than the defined thresholds
aFull capacity can be approximated by the pool water level at the point where there is no visible flow into and out of that pool.
Source: NSW’s Water Sharing Plan for the Namoi Unregulated and Alluvial Water Sources 2012; DPI Water (no date)
Table 47 summarises the increase in the number of cease-to-pump days due to additional coal resource development at model nodes. Baseline cease-to-pump days for the baseline 2013 to 2042 period are provided for context. Under the baseline, cease-to-pump for Baradine Creek is possible given the median value is zero while the 95th percentile value is 218 days. Bundock Creek experiences large numbers of cease-to-flow days and the change due to the additional coal resource development is reasonably small at a maximum of 12 days (5% chance) during the 2043 to 2072 period. The cease-to-flow for Maules Creek under the baseline is likely but does not change much due to additional coal resource development. For the Bohena Creek there is a 5% chance that cease-to-flow during the 2043 to 2072 period may increase by 9 days. The Mooki River at Breeza (node 35) has a large number of cease-to-flow days under the baseline due to its larger threshold (≤50 ML/day). These baseline values do not seem to change much either, as larger flows do not seem to be affected for this node due to additional coal resources development (see companion product 2.6.1 for the Namoi subregion (Aryal et al., 2018)). Nodes 28 and 29 on Coxs Creek also have larger numbers of cease-to-flow days under the baseline, which do not change noticeably due to additional coal resource development.
Table 47 Increase in cease-to-pump days due to additional coal resource development (ACRD)
Note that the baseline and additional coal resource development values are not additive.
Data: Bioregional Assessment Programme (Dataset 4)
