The hydrological response variables generated from the Namoi surface water modelling results are listed in Table 4. In this product, three were chosen to represent changes in low-flow regime (zero-flow days, ZFD), high-flow regime (high-flow days, FD) and mean annual flow (annual flow, AF) due to additional coal resource development.
3.3.4.1 Zero-flow days
The maximum increases in the number of zero-flow days per year during the simulated 90-year period (2013 to 2102) due to additional coal resource development are shown in Figure 15. Streams shown as ‘potential hydrological change’ may experience increases in zero-flow days, but the extent of this increase could not be quantified from the modelling. In some cases, results from upstream or downstream model nodes cannot be reliably interpolated to these reaches due to changes in hydrology along the reach from tributary inflows or due to the impact of mines. These are shown in Figure 15 as ‘direct’ change that relates to streams that flow through or start within a mine area, or ‘indirect’ relating to streams that are within the potential additional drawdown area. An indication of the potential increases in zero-flow days in the ‘potential hydrological change’ reaches near mining operations can be inferred from stream reaches immediately upstream and/or downstream, where the potential increases in zero-flow days have been quantified.
Five stream reaches are very likely to have an increase in zero-flow days of more than 20 days per year. They are: Back, Merrygowen and Bollol creeks, Mooki River at Breeza and Mooki River upstream of its confluence with the Namoi River. These streams drain Maules Creek, Boggabri expansion, Tarrawonga expansion and Watermark coal developments respectively (see Aryal et al. (2018)). Only Bollol Creek is very likely to have an increase in zero-flow days of more than 80 days. For Back, Merrygowen and Bollol creeks there is a 5% chance of an additional 200 or more zero-flow days. All of these creeks may not actually flow for 200 days. This apparent anomalous increase in zero-flow days occurs because in particularly wet years modelling indicates that the river can flow for more than 200 days per year as reflected in the 5% chance of that happening. As BAs report the maximum change in zero-flow days due to additional coal resource development, the reporting is biased towards a wet year when these maximum changes can occur.
The cumulative exceedance plots of stream length with additional zero-flow days in Figure 16 and the underpinning data in Table 9 indicate that at the 95th percentile, there are 1678 km of streams that could experience 3 or more additional zero-flow days per year. At the 5th percentile, this could be as small as 91 km of streams. Note that there are another unquantified but ‘potentially impacted’ 3629 km of streams where zero-flow days may also increase, but were not modelled, or not able to be extrapolated to. The potentially impacted stream lengths are the same for all hydrological response variables and all percentiles as it was not determined how these streams are affected with respect to each of the hydrological response variables and percentiles individually.
Where changes have been quantified, more than 3 additional zero-flow days are very likely in 53 km of streams in the Upper Namoi and 37 km of streams in the Mid Namoi. No streams in the Pilliga Outwash are very likely to experience such change.
The potentially large changes in some of the small tributary streams of the Namoi River are relatively localised. The much larger Namoi River is largely insensitive to these changes in inflows because of the volume of flow. Note that flows in the regulated river can be augmented through releases from storage.
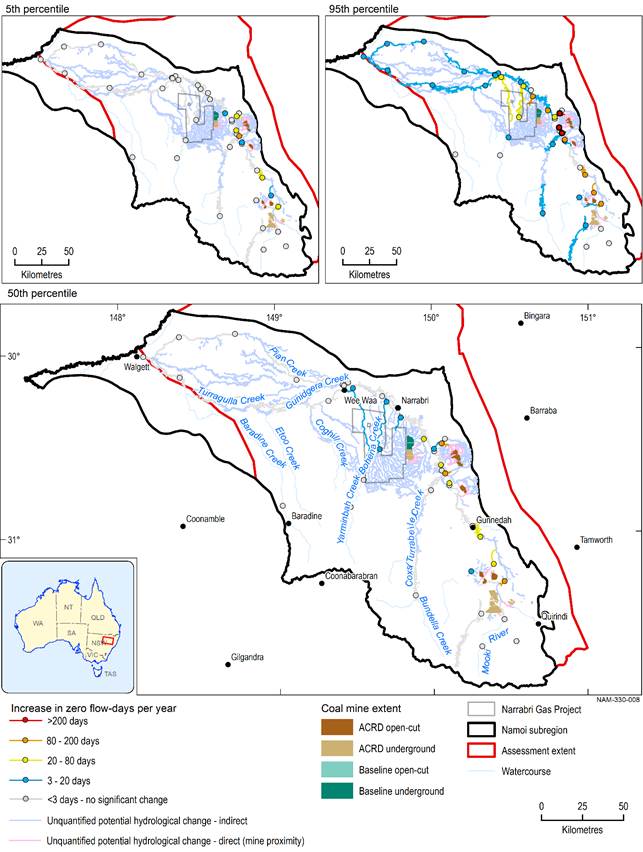
Figure 15 Increase in the number of zero-flow days due to additional coal resource development
The mine extents in the CRDP are the sum of those in the baseline and the additional coal resource development (ACRD).
Data: Bioregional Assessment Programme (Dataset 2)
Table 9 Stream length (km) potentially exposed to varying increases in zero-flow days in the zone of potential hydrological change
Due to rounding, some totals reported here may not correspond exactly with the sum of the separate numbers.
Data: Bioregional Assessment Programme (Dataset 5)
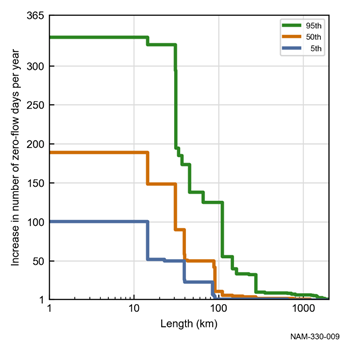
x-axis is in log scale.
Data: Bioregional Assessment Programme (Dataset 5)
To understand the significance of the modelled increases in zero-flow days, it is useful to look at them in the context of the natural interannual variability in zero-flow days. This is to see whether the predicted increases due to additional coal resource development are within the natural range of variability of the longer-term flow regime. The maximum increase in the number of zero-flow days due to additional coal resource development relative to the interannual variability in zero-flow days under the baseline has been adopted to put some context around the modelled changes. This ratio is shown for each surface water model node in Figure 17.
Table 10 provides the ratio ranges for ZFD, FD and AF adopted for each qualitative ratio class shown in Figure 17. Note that the changes shown in Figure 17 represent the maximum change due to additional coal resource development in a single year relative to the interannual variability across 90 years under the baseline. Thus, it is not a comparison of distributions, but an assessment of whether the change due to additional coal resource development, in the year of maximum difference between the CRDP and the baseline, is within the range of natural variability. If the maximum change is comparable to or greater than the interannual variability due to climate (e.g. an increase of 200 days relative to a baseline range of 20 to 50 days), then there is a greater risk of impact on the landscape classes and assets that rely on this water source.
Table 10 Ratio of increase in the number of zero-flow days (ZFD), high-flow days (FD) and annual flow volume (AF) due to additional coal resource development to the interannual variability in zero-flow days under the baseline
FD = high-flow days – in previous products, this is referred to as ‘flood days’
At the 5th percentile (Figure 17, top left), only one of the nodes has the predicted changes in zero-flow days comparable to interannual variability. The Bollol Creek draining the Tarrawonga expansion is very likely to experience a change in zero-flow days that is comparable to or greater than the interannual variability under the baseline. The rest of the nodes with significant changes have less than the interannual variability.
At the 50th percentile (Figure 17), the changes at three model nodes, in all Namoi reporting areas in unregulated streams, are comparable to or exceed the baseline interannual variability, suggesting changes in flow regime associated with reduced runoff and/or weaker connections to regional groundwater. At the 95th percentile (Figure 17, top right), the increases in zero-flow days that are greater than interannual variability at three locations across the assessment extent – all in unregulated streams where augmenting river flows through dam releases is not possible – suggest the possibility of zero-flow regime changes. Also, at the 95th percentile, one location in the Namoi Regulated River, where augmentation of river flow through dam release is possible, has increases in zero-flow days that are greater than interannual variability. In total there are 13 nodes for which there is a 5% chance of increase in ZFD comparable to or greater than interannual variability.
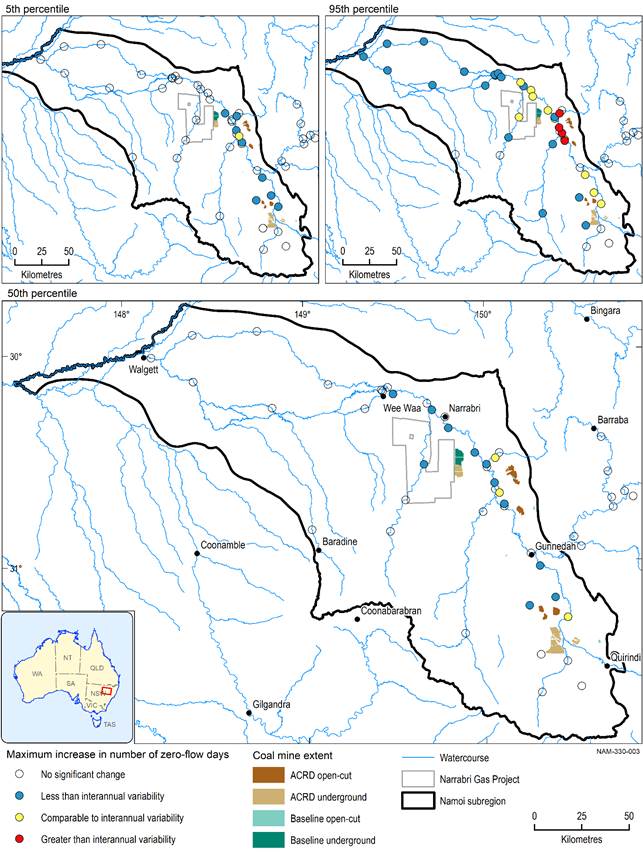
The extent of the coal resource developments in the coal resource development pathway (CRDP) is the union of the extents in the baseline and in the additional coal resource development (ACRD).
Data: Bioregional Assessment Programme (Dataset 7, Dataset 8)
3.3.4.2 High-flow days
Figure 18 shows the reduction in the number of high-flow days due to additional coal resource development in the Namoi subregion. Reduction of at least 3 high-flow days per year is very likely in six streams. They include Back, Merrygowen, Bollol and Driggle Draggle creeks draining Maules Creek, Boggabri expansion, Tarrawonga expansion and Vickery Creek coal developments. Two unnamed creeks impacted by the Watermark coal mine development are also affected. Among those, only the Back, Merrygowen and Bollol creeks are very likely to have a reduction in high-flow days of at least 10 days per year. None of the streams are very likely to have a reduction in high-flow days of more than 20 days per year, however, all of the above three creeks and one unnamed creek have a 5% chance of having a reduction in high-flow days of more than 50 days per year.
A cumulative exceedance plot of these reductions in high-flow days is shown in Figure 19, and the summary data, showing the length of potentially impacted streams, are presented in Table 11. The table lists the 5th, 50th and 95th percentiles of the stream length associated with reduction in high-flow days of different durations. It shows that reductions in high-flow days of at least 3 days per year are very likely in 34 km of stream in the Mid Namoi reporting area, which contains the Maules Creek, Boggabri expansion, Tarrawonga expansion and Vickery coal mine developments. At the 95th percentile, there are 31 km of streams that experience a reduction of more than 50 high-flow days per year. Most probabilities of reductions in high-flow days are found in the Mid Namoi, with just a 5% chance of a 3 to 10 day reduction in high-flows per year in 53 km of stream length of the Upper Namoi and 20 km of the Pilliga and Pilliga Outwash reporting areas.
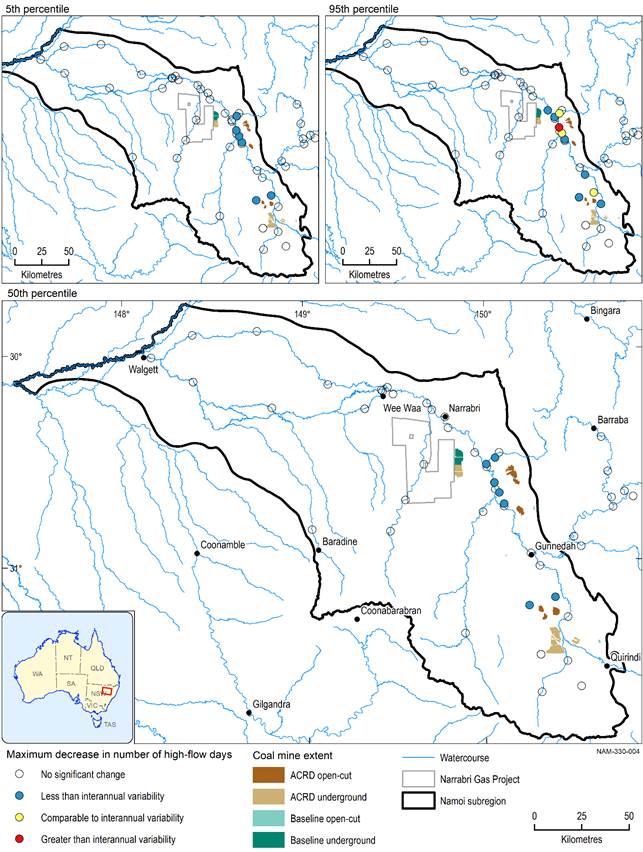
Figure 20 shows the comparison of maximum change in high-flow days due to additional coal resource development and interannual variability in high-flow days under the baseline. At the 5th and 50th percentiles, all changes are either not significant or less than interannual variability. At the 95th percentile, there are four nodes which show reductions in high-flow days that are either similar to or greater than interannual variability. These four nodes, which drain catchments near Maules Creek, Boggabri expansion, Tarrawonga expansion and Watermark mine developments, could potentially experience reductions in high-flow days that take the high-flow regime outside the interannual variability previously seen under the baseline.
Generally, the impact of additional coal resource development on the reduction in high-flow days is not as great as it is on zero-flow days. In particular, the decrease in number of high-flow days in Maules Creek, Boggabri expansion, Tarrawonga expansion and Watermark mine developments are noticeably less than the increase in number of zero-flow days.
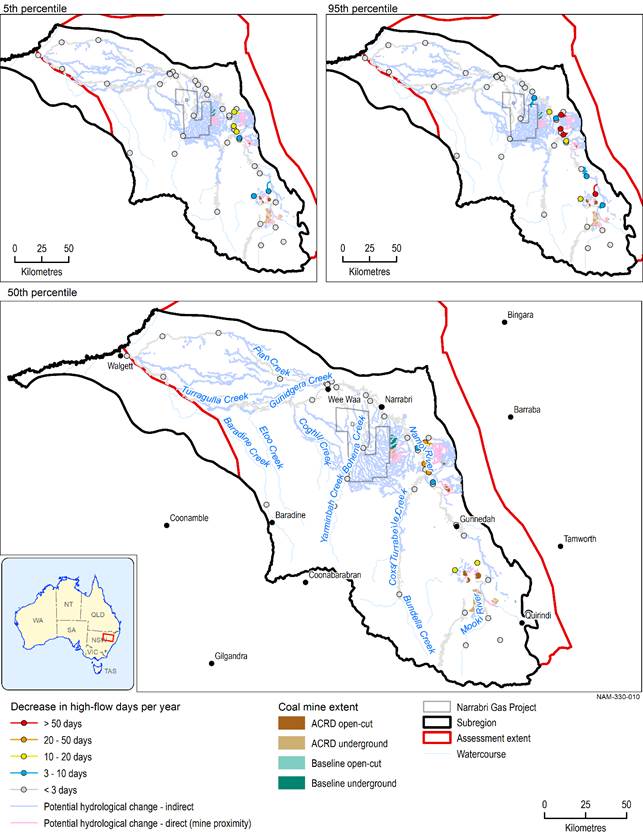
Figure 18 Decrease in the number of high-flow days due to additional coal resource development
Data: Bioregional Assessment Programme (Dataset 2)
Table 11 Stream length (km) potentially exposed to varying reductions in high-flow days in the zone of potential hydrological change
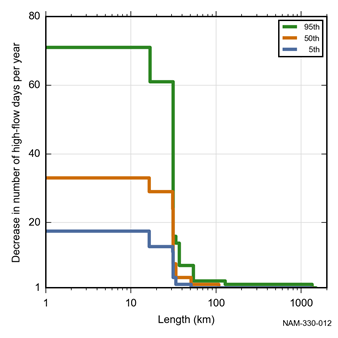
x-axis is in log scale.
Data: Bioregional Assessment Programme (Dataset 5)
The extent of the coal resource developments in the coal resource development pathway (CRDP) is the union of the extents in the baseline and in the additional coal resource development (ACRD).
Data: Bioregional Assessment Programme (Dataset 7, Dataset 8)
3.3.4.3 Annual flow
The annual flow (AF) represents the maximum percentage change due to additional coal resource development in the annual flow volume in the year showing the maximum change over the simulated 90-year period (2013 to 2102). This is shown in Figure 21 for stream reaches in the surface water zone of potential hydrological change. A cumulative exceedance plot of the reduction in annual flow is shown in Figure 22, with summary data presented in Table 12
Decreases in mean annual flow of at least 1% are very likely in seven creeks covering 51 km of modelled streams. They include: Back and Maules creeks both draining the Maules Creek Coal Project; Merrygowen, Bollol and Driggle Draggle creeks draining Boggabri expansion, Tarrawonga expansion and Vickery coal developments, respectively. The remaining two creeks are unnamed creeks draining the Watermark coal mine development.
Decreases in mean annual flow of 5% to 20% are very likely in five of these seven creeks covering 19 km of modelled streams. They are: Back, Merrygowen and Driggle Draggle creeks and two unnamed creeks draining the Watermark coal mine development.
There is a 5% chance of reductions in annual flow of 20% to 50% at two stream nodes representing 17 km of the Merrygowen and Back creeks in the Mid Namoi.
Reductions in annual flow of more than 1% are almost entirely limited to the Mid Namoi reporting area, with just 20 km of streams in the Pilliga and Pilliga Outwash reporting area showing changes at the 5th percentile. These changes are localised as these relatively minor streams feed into the much larger Namoi River, which is largely insensitive to these changes in inflows.
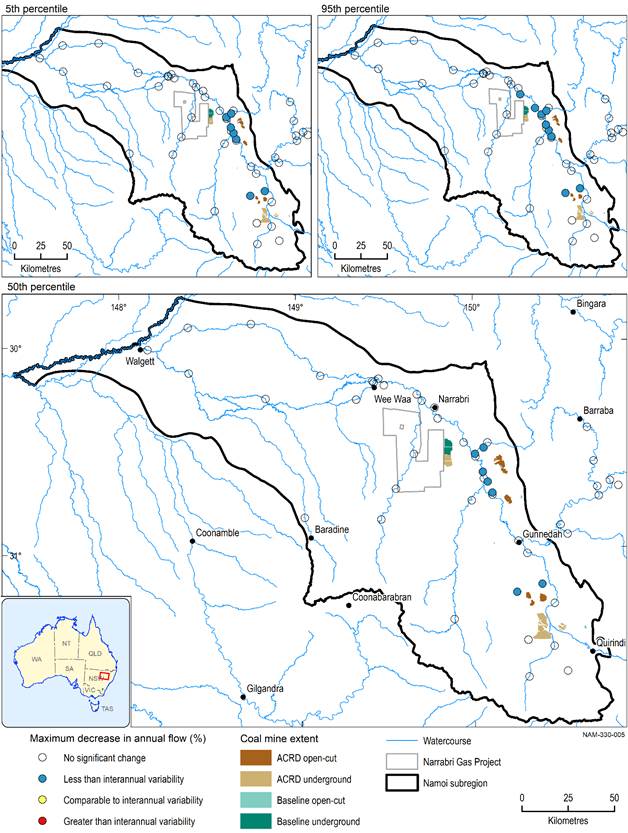
The ratio of reduction in annual flow to the interannual variability seen under the baseline is shown in Figure 23. It shows that only at some nodes in the Mid Namoi is the change less than interannual variability. For most other nodes there are no significant changes.
Reductions in annual flow are similar for all three percentiles. This is because reduction in annual flow is driven primarily by direct interception of surface runoff by open cut mines. The probability of this reduction does not vary. Only a small component of the reduction in annual flow is driven by changes in baseflow due to reduced surface water – groundwater connectivity.
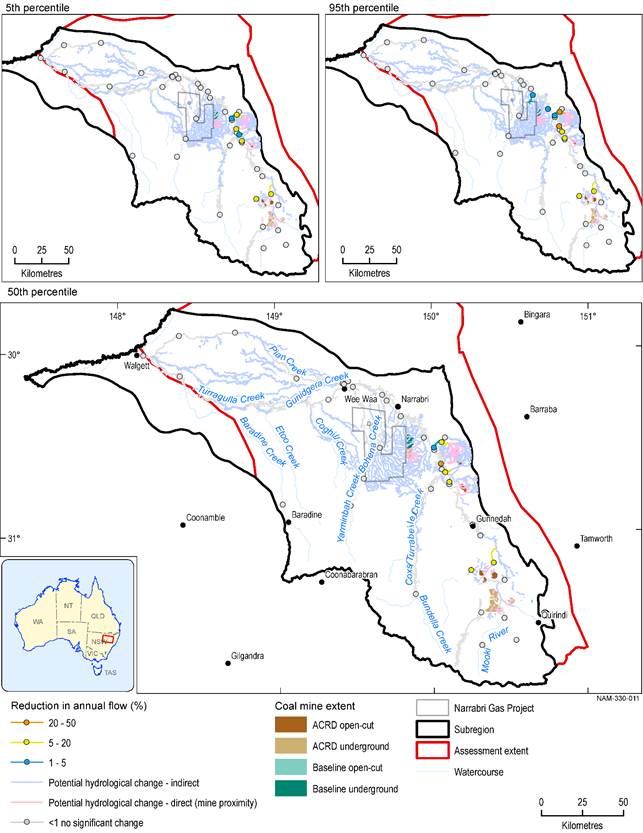
Figure 21 Reduction in annual flow due to additonal coal resource development
The extent of the coal resource developments in the coal resource development pathway (CRDP) is the union of the extents in the baseline and in the additional coal resource development (ACRD).
Data: Bioregional Assessment Programme (Dataset 2)
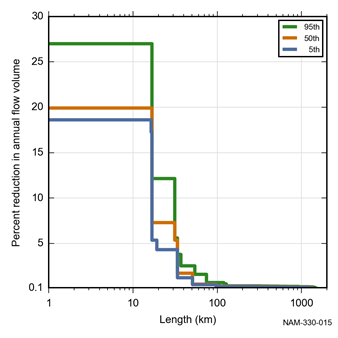
x-axis is in log scale.
Data: Bioregional Assessment Programme (Dataset 5)
Table 12 Stream length (km) potentially exposed to varying reductions in annual flow in the zone of potential hydrological change
Data: Bioregional Assessment Programme (Dataset 5)