The Walloon Coal Measures are composed of coal, shale, sandstone, siltstone and mudstone (e.g. Rassam et al., 2014). Coals in the Walloon Coal Measures are high-volatile bituminous to low‑volatile bituminous and sub-bituminous (Matheson, 1993; Ingram and Robinson, 1996; Doig and Stanmore, 2012), based on the American Society for Testing and Materials (ASTM) classification scheme (Appendix A). The coal of the Walloon Coal Measures in the Clarence‑Moreton Basin has been described as slightly higher in rank than the Walloon Coal Measures coals in the linked Surat Basin (Matheson, 1993). Kerogen types in the Walloon Coal Measures range from Type I to Type III (O’Brien et al., 1994), but most are Types II and III (O’Brien et al., 1994; Ingram and Robinson, 1996). The maceral composition of the coal is dominated by vitrinite, whereas the disseminated organic material is composed of vitrinite and to a lesser degree liptinite and inertinite (Ingram and Robinson, 1996). Ingram and Robinson (1996) suggested that the volatile content of the coal may be as high as 54% with a mean hydrogen content of about 6 to 7%. Doig and Stanmore (2012) explained that the rank of the coal varies with depth of burial, location and proximity to igneous intrusions. The coal of the Walloon Coal Measures is classified as thermal black coal (OZMIN database, Geoscience Australia, 2012). The unit is generally thinner near the basin margins, and ranges between 400 and 700 m in the central Laidley and Logan sub‑basins (Figure 5). The discrepancy between the Walloon Coal Measures thickness suggested by the isopach (thickness) contours (Figure 5) based on Ingram and Robinson (1996) and the thickness recorded at exploration wells north of Casino is due to data that have become available from more recent exploration drilling. An updated isopach map of the Walloon Coal Measures based on all available well log and seismic data will be presented in companion product 2.3 for the Clarence-Moreton bioregion. The coal seams are not as well developed in the southern part of the Clarence‑Moreton bioregion in NSW, as suggested by the decrease of the thickness of coal within the Walloon Coal Measures south of the Casino and Lismore troughs (Doig and Stanmore, 2012). Recent well completion reports indicate that there is, for example, a net coal thickness of 19.1 m within the Walloon Coal Measures at the Peacock 1 CSG exploration well (Gordon, 2010), 49 m in the Walloon Coal Measures in Corella E9 CSG well (Johnson et al., 2008a) and 55 m within the Walloon Coal Measures sequence at the Corella E10 CSG well (Johnson et al., 2008b), whereas a cumulative thickness of 120.1 m of coal has been recorded at the Kingfisher-1 petroleum exploration well (Burgess, 2010). This shows that only a comparatively small part of the Walloon Coal Measures consists of coal, and the majority is composed of interburden.
The coal within the Walloon Coal Measures occurs within multiple seams. In the Corella E9 CSG exploration well, for example, nine different seams have been identified within the Walloon Coal Measures sequence (Johnson et al., 2008a). The Richmond Seam (one of the youngest and thickest seams in the Walloon Coal Measures) is very extensive and can be correlated over tens of kilometres based on its distinct signal that can be identified in geophysical logs (Doig and Stanmore, 2012). Arrow Energy Pty Ltd has differentiated coal seams encountered in CSG exploration wells in the Clarence‑Moreton bioregion into an ‘Upper Coal Zone’ and a ‘Lower Coal Zone’ (e.g. Nightingale, 2010), each of which can consist of several coal seams of variable thickness. It is currently unknown whether the coal seams of the Walloon Coal Measures in the Clarence‑Moreton bioregion in NSW and Queensland can be correlated with the coal seams in the western part of the Clarence‑Moreton Basin (part of the Northern Inland Catchments bioregion) and the Surat Basin. However, Doig and Stanmore (2012) suggested that the high inertinite content of the Richmond Seam in the Casino area (17%) and in the upper Juandah Coal Measures, a major sequence of coal seams in the western part of the Clarence‑Moreton Basin and in the Surat Basin (10%), may indicate that these seams are time equivalents.
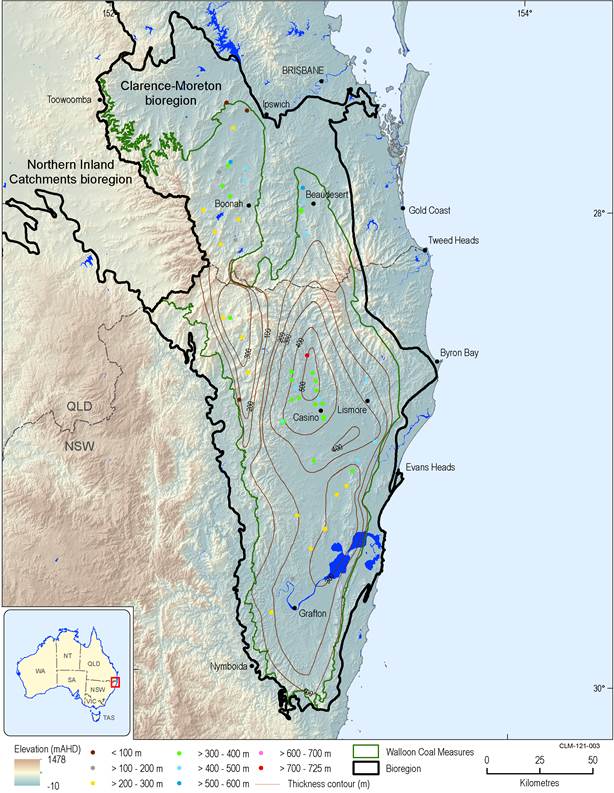
Source data: isopach contours modified from Ingram and Robinson (1996); the thickness of the Walloon Coal Measures is only shown for wells where the full sequence of the Walloon Coal Measures (i.e. where the formation underneath the Walloon Coal Measures (Koukandowie Formation)) has been intersected. Coal seam gas, petroleum and coal exploration well locations and Walloon Coal Measures thickness data are sourced from (i) NSW Digital Imaging Geological Systems (NSW Trade & Investment, 2014a), © NSW Trade & Investment; (ii) Queensland Digital Exploration Reports (State of Queensland, 2014), © The State of Queensland 2014. Stratigraphic well data are based on Wells and O’Brien, 1994.
