2.7.5.2.1 Pilliga riverine (upland and lowland)
The Pilliga riverine qualitative model includes all upland and lowland riverine landscape classes in the Pilliga due to streams in this region having a unique set of conditions (Figure 26). These streams were characterised as having sandy beds, temporary flow with some permanent pools above highly stratified sandstone, and channels that often form shallow and poorly defined ephemeral wetlands.
A model was developed for these streams based on the model for streams in the upland and lowland riverine landscape classes (Figure 26). The sand-dominated substrate and low gradient of these stream channels meant that fast-water habitats are of minimal importance, and thus the fast-water associated variables were omitted from the model. Other variables that were deemed to not be important to these streams, and thus omitted, included flood velocity, bank stability, fine sediment, suspended sediment, biological oxygen demand, algal blooms, phosphorus runoff, land clearing and grazing, catchment vegetation, cyanobacteria and salinity (Figure 26).
There were several components and processes considered important to these stream systems that were added to the model. Tannins that leach into stream water from particulate organic matter were considered to be an important regulator of water temperature (Morrongiello et al., 2011) (Figure 26). Additionally, iron flocculants from groundwater inputs have the effect of suppressing levels of dissolved oxygen and impact on native fishes. Groundwater inputs were also described as being important in maintaining slow-water habitats, riparian trees and riparian vegetation. Non‑native fishes were portrayed as having a negative impact on native fishes and slow-water invertebrates and tadpoles, though in return, the abundance of these two prey groups was determined to not be a significant factor in controlling the population of non-native fish (thus no positive link from these prey back to non-native fish predator). The abundance of non-native fishes, however, was described as being regulated by periodic disconnection of the stream channel into pool habitats during periods of low and zero flows (Figure 26).
Riparian trees were described as being dependent on groundwater and also water obtained from the stream channel, hence, the maximum depth of the watertable and the number of low-flow days were considered as potentially important hydrology variables (Pfautsch et al., 2015) (Figure 26). The maximum depth of the watertable was also considered important in controlling the amount of groundwater input to the stream channel (Brunner et al., 2009). The number of low-flow days was deemed to be important in determining the degree to which pool habitats were maintained and connected, and in regulating levels of dissolved oxygen and water temperature (Rolls et al., 2012) (Figure 26).
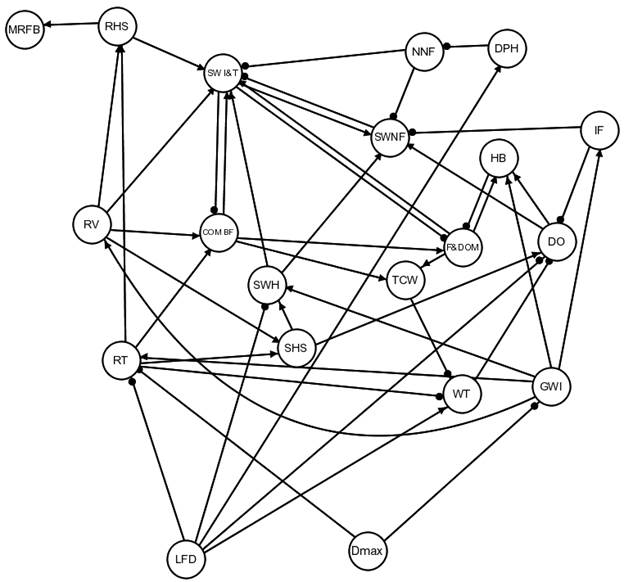
Figure 26 Signed digraph model of the Pilliga riverine ecosystem
Model variables are: coarse particulate organic matter and biofilm (COM BF), maximum decrease in watertable (Dmax), dissolved oxygen (DO), disconnected pool habitats (DPH), fine particulate and dissolved organic matter (F&DOM), groundwater input to river (GWI), hyporheic biota (HB), iron flocculate (IF), low-flow days (LFD), mammals, reptiles, frogs and birds (MRFB), non-native fishes (NNF), riparian habitat structure (RHS), riparian trees (RT), riparian vegetation (excluding trees) (RV), stream habitat structure (SHS), slow-water invertebrates and tadpoles (SW I&T), slow-water habitat (SWH), slow-water native fishes (SWNF), tannin-coloured water (TCW), water temperature (WT).
Data: Bioregional Assessment Programme (Dataset 4)
Surface water and groundwater modelling predict significant potential impacts to low-flow days and maximum depth to groundwater level. Based on all combinations of these impacts, three cumulative impact scenarios were developed for qualitative analysis of response predictions (Table 33).
Table 33 Summary of the (cumulative) impact scenarios (CIS) for the Pilliga riverine ecosystem
|
CIS |
LFD |
Dmax |
|---|---|---|
|
C1 |
+ |
0 |
|
C2 |
0 |
+ |
|
C3 |
+ |
+ |
Pressure scenarios are determined by combinations of no-change (0) or an increase (+) in the following signed digraph variables: low-flow days (LFD) and maximum decrease in watertable (Dmax).
Data: Bioregional Assessment Programme (Dataset 4)
Qualitative analyses of the signed digraph model (Figure 26) generally indicate a negative or ambiguous response prediction for all biological variables within the Pilliga riverine ecosystem (Table 34). Riparian trees and riparian vegetation were generally predicted to decline, as were native fishes, mammals, reptiles, frogs and birds. Hyporheic biota were predicted to decrease in scenarios involving an increase in the number of low-flow days. The predicted response of slow-water invertebrates and tadpoles, however, was ambiguous across all cumulative impact scenarios.
Table 34 Predicted response of the signed digraph variables in the Pilliga riverine ecosystem to (cumulative) changes in hydrological response variables
Qualitative model predictions that are completely determined are shown without parentheses. Predictions that are ambiguous but with a high probability (0.80 or greater) of sign determinancy are shown with parentheses. Predictions with a low probability (less than 0.80) of sign determinancy are denoted by a question mark. Zero denotes completely determined predictions of no change.
Data: Bioregional Assessment Programme (Dataset 4)
2.7.5.2.2 Grassy woodland GDE – Pilliga region
The vast majority of the ‘Grassy woodland GDE’ landscape class in the Namoi assessment extent is located in the Pilliga region. The qualitative model centred on the ecological processes associated with trees, shrubs and grasses, with three functional groups of shrubs defined by their relationship with fire (Figure 27). Fire-sensitive shrubs are suppressed by fire; fire-obligate shrubs, which require fire events for regeneration; and fire-tolerant shrubs, which can survive fire (Purdie and Slatyer, 1976). Fire events in this landscape class are fuelled by large woody debris, leaf litter and grasses (Figure 27). All groups of shrubs suppress the growth of grasses. Finer soil textures favour grasses over shrubs (Norris, 1996). The stores of woody debris and litter that are not consumed by fire contribute, through decomposition, to the soil microbial community and populations of ground-dwelling insects (York, 1999). These insects are a primary food resource for ground-dwelling invertebrates and burrowing frogs, both of which benefit from the habitat structure provided by grass communities (Figure 27). Trees (specifically large old-growth trees) were described as providing the key habitat of tree hollows for arboreal vertebrates (i.e. birds and mammals) (Figure 27).
The soil microbial community was identified as a major contributor to stores of dissolved organic matter and nutrients in soil; trees were also identified as making contributions to these stores via root excretions (Lambers et al., 2006) (Figure 27). The dissolved organic matter and nutrients in soil constitute a resource consumed by groundwater biota, which were also described as possibly increasing the availability of both water and nutrients to tree roots via increasing local hydraulic conductivity. These latter two processes, however, were considered as being uncertain, which led to development of two alternative models, one with a positive effect from groundwater biota to trees (Figure 27) and one without this link (Figure 28).
The level of the watertable is a critical factor for the survival of burrowing frogs, both clay-cocooning and sandy-soil aestivators, and also the growth and survival of trees and fire-tolerant shrubs (Figure 27). The maximum depth below ground to the watertable was identified as a potentially important hydrologic response variable that could affect the growth and survival of trees.
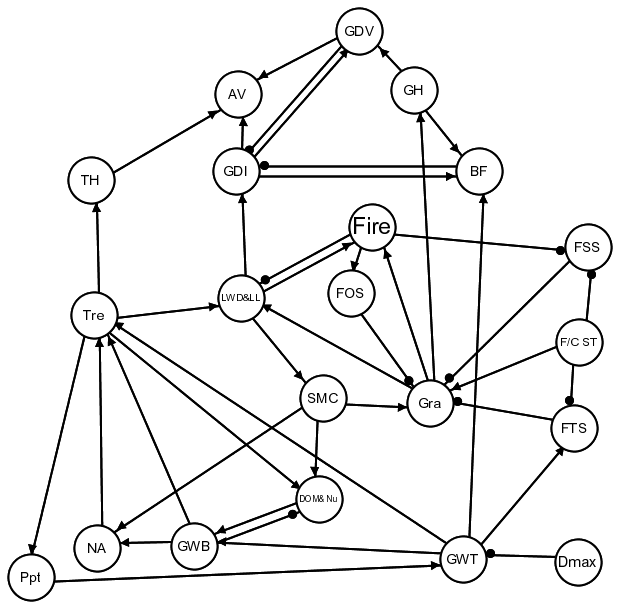
Figure 27 Signed digraph model of the 'Grassy woodland GDE' landscape class (Model 1)
Model variables are: arboreal vertebrates (AV), burrowing frogs (BF), maximum decrease in watertable (Dmax), dissolved organic matter and nutrients (DOM&Nu), fine-coarse soil texture ratio (F/C ST), wildfire (Fire), fire-obligate shrubs (FOS), fire-sensitive shrubs (FSS), fire-tolerant shrubs (FTS), ground-dwelling invertebrates (GDI), ground-dwelling vertebrates (GDV), ground habitat (GH), grass (Gra), groundwater biota (GWB), groundwater table (GWT), large woody debris and leaf litter (LWD&LL), nutrient availability (NA), precipitation (Ppt), soil microbial community (SMC), tree habitat (TH), trees (Tre).
Data: Bioregional Assessment Programme (Dataset 4)
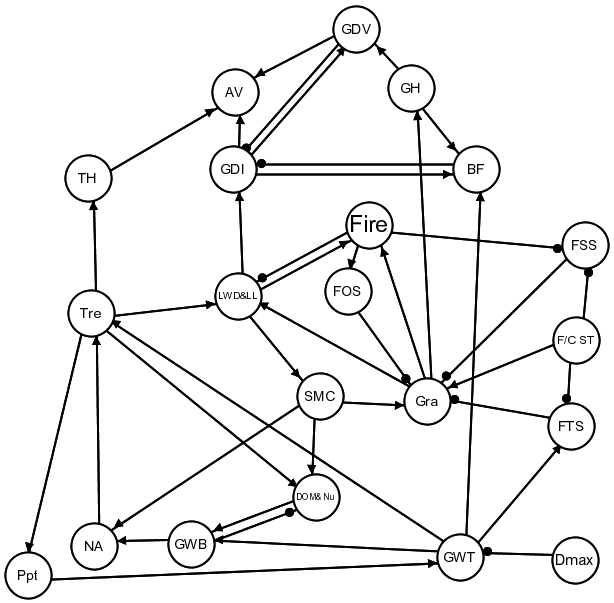
Figure 28 Signed digraph model of the 'Grassy woodland GDE' landscape class (Model 2)
Model variables are: arboreal vertebrates (AV), burrowing frogs (BF), maximum decrease in watertable (Dmax), dissolved organic matter and nutrients (DOM&Nu), fine-coarse soil texture ratio (F/C ST), wildfire (Fire), fire-obligate shrubs (FOS), fire-sensitive shrubs (FSS), fire-tolerant shrubs (FTS), ground-dwelling invertebrates (GDI), ground-dwelling vertebrates (GDV), ground habitat (GH), grass (Gra), groundwater biota (GWB), groundwater table (GWT), large woody debris and leaf litter (LWD&LL), nutrient availability (NA), precipitation (Ppt), soil microbial community (SMC), tree habitat (TH), trees (Tre).
Data: Bioregional Assessment Programme (Dataset 4)
Surface water and groundwater modelling predict significant potential impacts to the maximum depth of groundwater, from which a single cumulative impact scenario (C1) was developed (Table 35).
Table 35 Summary of the (cumulative) impact scenario (CIS) for the ‘Grassy woodland GDE’ landscape class
|
CIS |
Dmax |
|---|---|
|
C1 |
+ |
Data: Bioregional Assessment Programme (Dataset 4)
Qualitative analysis of the signed digraph models indicates ambiguous response prediction for many of the biological variables within the grassy woodland ecosystem for both Model 1 and Model 2 (Table 36). This widespread ambiguity in the predictions is a result of positive feedback in a number of subsystems of this model. Such subsystems include the grass- large woody debris and leaf litter-soil microbial community system, and the grass-fire-fire sensitive shrub system. Trees, tree habitat, grass and ground habitat were all predicted to decrease in Model 1, but had ambiguous predictions in Model 2. Wildfire was predicted to decrease in both models, leading to a predicted increase in fire-sensitive shrubs and a decrease in fire-obligate shrubs.
Table 36 Predicted response of the signed digraph variables for Model 1 (Figure 28) and Model 2 (Figure 29) in the ‘Grassy woodland GDE’ landscape class to (cumulative) changes in hydrological response variables
Qualitative model predictions that are completely determined are shown without parentheses. Predictions that are ambiguous but with a high probability (0.80 or greater) of sign determinancy are shown with parentheses. Predictions with a low probability (less than 0.80) of sign determinancy are denoted by a question mark. Zero denotes completely determined predictions of no change.
Data: Bioregional Assessment Programme (Dataset 4)
