To date, much of the work assessing groundwater flows within the subregion has focused on aquifers of the Great Artesian Basin (GAB). The earliest comprehensive GAB-wide potentiometric surface of the Jurassic-Lower Cretaceous combined aquifers was produced by Audibert (1976) for the years 1900 and 1970. In addition, Audibert (1976) produced a watertable map and a potentiometric surface for the first confined aquifer which equates to the Winton and Mackunda formations within the subregion. Subsequently, Habermehl (1980) produced modified potentiometric surfaces for 1880 and 1970 for the Jurassic-Lower Cretaceous aquifers and a regional watertable map, based on the GABHYD simulation model (Seidel, 1978), from which the regional groundwater flow directions in the Jurassic-Lower Cretaceous aquifers were inferred. (Radke et al., 2000) reported regional flow direction within the Cadna-owie – Hooray Aquifer based on the GABMOD steady state model (Welsh, 2000) which differed from that of Habermehl (1980). More recently a regional watertable map for the topmost GAB formations and a 2010 potentiometric surface map of the Cadna-owie – Hooray aquifer was produced as part of the Great Artesian Basin Water Resources Assessment (Ransley and Smerdon, 2012) (Figure 31).
RPS (2012) compiled the Queensland DERM and QPED databases and generated the potentiometric surfaces for Eromanga Basin aquifers within the extents of the Galilee Basin boundary. Due to insufficient data and the bias of bore distribution towards the eastern part of the Galilee Basin, no potentiometric surface was generated for the Galilee Basin aquifers in the RPS (2012) report.
Using the compiled data in the RPS (2012) report, groundwater elevation contour maps for the various aquifer groups have been produced and are shown in Figure 32, Figure 33 and Figure 34.
These groundwater elevation contour maps were constructed using water level data measurements taken at different times. They can be used to elucidate trends in the aquifer system at a semi-regional scale but do not represent a ‘snapshot’ of groundwater levels at a specific time. Few bores in the Galilee subregion have time series groundwater level data.
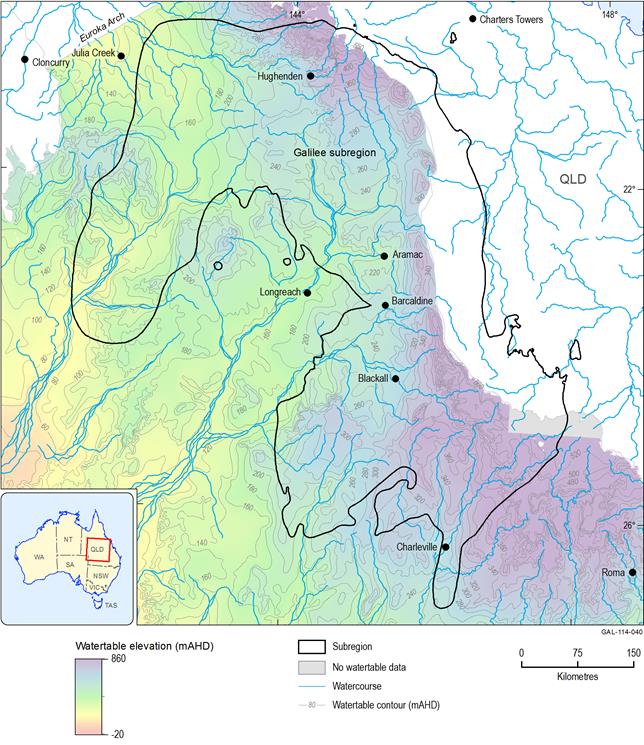
Figure 31 Regional shallow watertable for the Eromanga Basin
Source data: after Figure 6.2, Ransley and Smerdon (2012).
1.1.4.3.1 Underlying basins and basement
Limited information is available on hydrogeological systems that may operate below the Galilee Basin.
1.1.4.3.2 Galilee Basin
Using data available from RPS (2012), a preliminary potentiometric surface was created by contouring the groundwater levels from the Triassic formation aquifers, specifically the Warang Sandstone, the Clematis Group and the Dunda beds (Figure 32). To produce the figure, an assumption was made that there is hydraulic connectivity between the different aquifers. The reason this assumption was made is that no aquitards separate the different aquifer units; therefore these units are likely to be in direct connection. There is no temperature information on static water levels and the hydraulic head has not been corrected for temperature gradient. Potentiometry for these aquifers will be further analysed as part of the Galilee subregion bioregional assessment.
For the Warang Sandstone, Clematis Group and Dunda beds, water levels are slightly higher in the south-east (350–450 mAHD) of the Galilee Basin (Figure 32) than the north-east (250–350 mAHD) and are interpreted as potential recharge areas. There appears to be a general convergence of flow towards the central-eastern part (water levels of 250–300 mAHD) of the basin, in the vicinity of the Carmichael River.
In the northern Galilee Basin, the Rewan Group is likely to cause a degree of hydraulic disconnection between the Late Permian Colinlea Sandstone aquifer and Triassic aquifers – the Clematis Group and the Warang Sandstone. In the southern Galilee Basin, the Rewan Group is largely absent (Scott et al., 1995) but the Black Alley Shale, where present, may still impede hydraulic connectivity. Only a few wells around the eastern margin of the Galilee Basin were identified by RPS (2012) as tapping the Colinlea Sandstone. From the limited available data for the south-eastern edge of the subregion, the static water level of the Colinlea Sandstone is consistent between 300 and 350 mAHD.
Limited information is available on groundwater discharge from the Galilee Basin. Also, a lack of information from far southern parts of the Galilee Basin (the Powell Depression and south of Springsure Shelf) makes it difficult to deduce potential groundwater discharge pathways. The artesian pressures and the near surface sub-artesian groundwater levels for aquifers in the Warang Sandstone, the Clematis Group and the Dunda beds suggest that groundwater in the Galilee Basin has the potential to leak into the overlying Carmichael and Belyando rivers, provided a pathway exists.
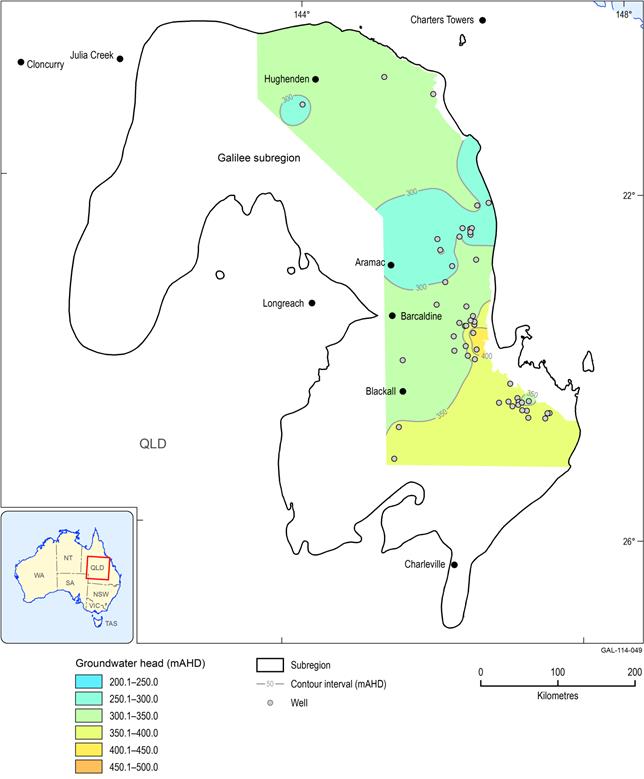
Source data: RPS (2012) Appendix D
Well locations where the information was sourced are shown.
1.1.4.3.3 Eromanga Basin aquifers
On a regional scale, groundwater in the Eromanga flows from recharge areas along the Great Dividing Range and westwards towards the discharge zones of the western Eromanga Basin. Discharge areas include Lake Eyre and an arcuate band containing lakes Frome, Callabonna, Blanche and Gregory (Smerdon and Ransley, 2012, p. 81). This is in contrast to the groundwater flow potential in parts of the underlying Warang Formation, Clematis Group and Dunda beds aquifers, where it has been proposed in some recent environmental impact statements that groundwater flow is from the south and north towards the Carmichael River. This however is yet to be substantiated.
The watertable (Figure 31) lies in the areas of outcrop of all the GAB aquifers (intake beds) and aquitards along the western slopes of the Great Dividing Range. It then passes into the Rolling Downs Group which abuts the intake beds and dips gently basinward (Smerdon and Ransley, 2012, p. 82). The largest area of occurrence of the watertable – throughout the vast plains of western Queensland – lies in the Early to Late Cretaceous Winton Formation, and less commonly, in the underlying Early Cretaceous Mackunda Formation. Nevertheless, the Winton and Mackunda formations form a hydraulically continuous unit, and thus water levels in the Mackunda Formation can also be regarded as equivalent to the regional watertable (Smerdon and Ransley, 2012, p. 82).
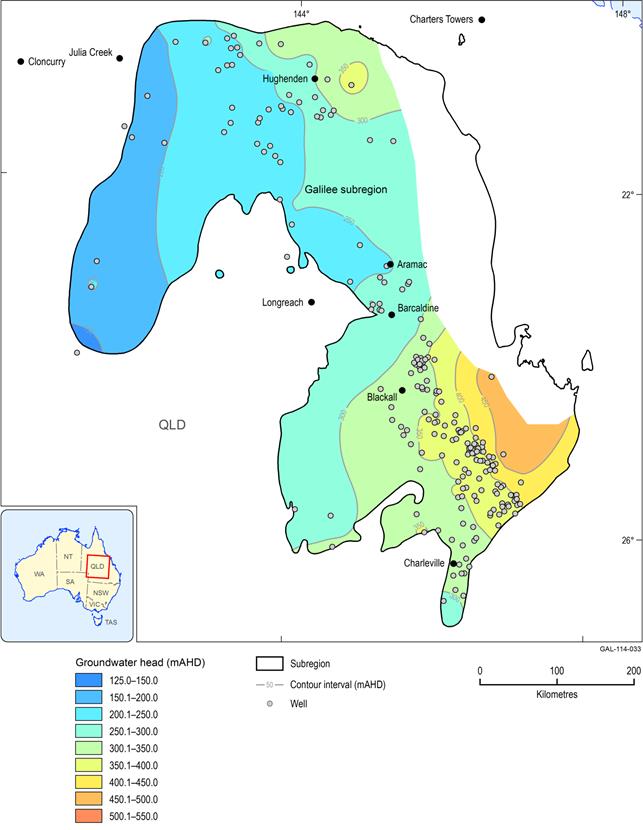
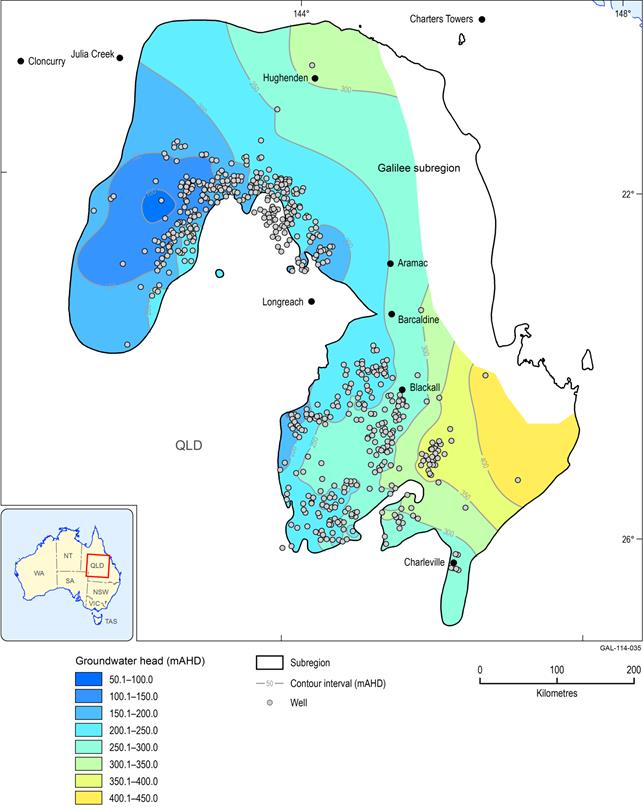
Despite the slight bias in distribution of wells towards the south and the central west of the subregion, the groundwater hydraulic head of the aquifers in the Rolling Downs Group (Figure 35) provides a general depiction of groundwater gradient, possible flow directions and recharge areas within the Galilee subregion. Groundwater elevation is the highest (400–450 mAHD) in the south-eastern part and relatively high in the north. The recharge areas are the north, east and south-east of the subregion. In the south, groundwater flows towards the west and in the north, groundwater flows towards south-west.
Deep regional confined aquifers in the Eromanga Basin include the Hutton Sandstone, the Hooray Sandstone and the Wyandra Sandstone member of the Cadna-owie Formation. The potentiometric surface for the Hutton Sandstone (Figure 33) shows a local high (500–550 mAHD) in the south of the subregion. The aquifers are recharged in the east, along the Great Dividing Range, with groundwater flowing down the hydraulic gradient towards the north-west and west.
The combined groundwater potentiometric surface of the Wyandra Sandstone Member of the Cadna-owie Formation, and Hooray Sandstone aquifers is shown in Figure 34, assuming vertical connectivity between the aquifers. There is no temperature information on the static water levels and the hydraulic head has not been corrected for temperature gradient. The potentiometric surface shows high static water levels (450–500 mAHD) in the southern part of the subregion. This potentiometric surface is even higher than those of the Rolling Downs Group aquifers, suggesting that the aquifers are confined and there is potential for upward flow if pathways exist. The potentiometric surface is also relatively high in the north and the overall gradient and flow is towards the west. Recharge areas for these aquifers are taken to be the outcrops and shallow subcrop at the Great Diving Range in the east. RPS (2012) has identified a northward component of the flow towards the Flinders River system and potentially discharging into the Carpentaria Basin in the north.
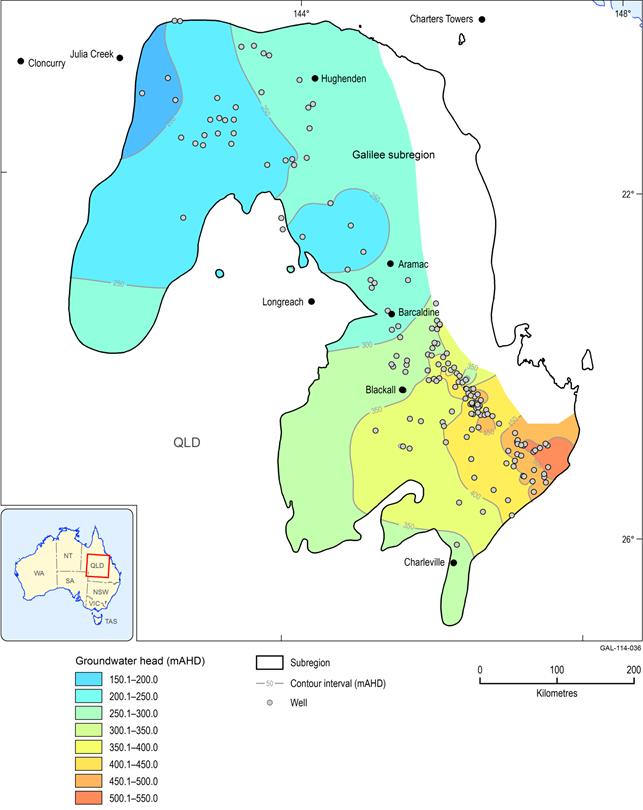
Figure 33 Potentiometric surface of groundwater head of the Jurassic Hutton Sandstone aquifer
Source data: RPS (2012) Appendix D
Well locations where the information was sourced are shown.
Source data: RPS (2012) Appendix D
Well locations where the information was sourced are shown.
Source data: RPS (2012) Appendix D
Well locations where the information was sourced are shown.
1.1.4.3.4 Cenozoic
Across the channel country in the semi-arid zone, recharge is low as potential evaporation exceeds precipitation. Periodic high precipitation may result in high river flow or floods and recharge into the Cenozoic aquifers. The extent of diffuse recharge occurring across the channel plains during flood events is unknown.
The regional watertable slopes from the north-east and east to the south-west, sympathetic with the topography (Smerdon and Ransley, 2012, p. 81) (Figure 31). The watertable in Cenozoic sediments generally forms a continuum with the pressure surface of the first water cut in the underlying Eromanga Basin aquifers, most commonly the Winton Formation of the Rolling Downs Group. However, water levels in some alluvial bores within and peripheral to stream channels may temporarily lie above the regional watertable following periods of high river stages when they are recharged (Ransley and Smerdon, 2012). Temporary head differences of 10 to 15 m have been observed. These perched systems are very dynamic compared to the much slower moving and less responsive regional watertable. However, the fluctuations in groundwater levels in the alluvium of the river channels represent an interesting phenomenon and may shed light on locations of point source recharge to the regional GAB aquifers (Ransley and Smerdon, 2012).
1.1.4.3.5 Inter-aquifer leakage
Based on a regional hydrostratigraphic classification of GAB units, potential connectivity with underlying basins is offered by the overlap of adjacent aquifers and leaky aquitards above and below the basal unconformity of the Eromanga Basin. In Figure 36, the basal hydrostratigraphic units of the Eromanga Basin are denoted by patterns and the uppermost stratigraphic units of the Galilee and Cooper basins, as well as the Thomson Orogen basement rocks, are depicted by colours.
From the potential hydraulic interconnectivity map (Figure 36), the Galilee Basin area is mostly covered in light blue, which demarcates the presence of the Moolayember Formation leaky aquitard. This formation impedes the hydraulic connectivity between the Eromanga and Galilee basin aquifers. In Figure 36, areas shaded dark to medium blue represent zones where Galilee Basin aquifers underlie and are likely to be directly in contact with the Eromanga Basin aquifers such as the Hutton Sandstone. Where the basal unit for the Eromanga Basin sequence is an aquifer and there is direct contact between it and Galilee Basin aquifers would be areas with good potential connectivity. In the Galilee subregion this configuration occurs near the western margin of the Galilee subregion (in the vicinity of Longreach and Winton), south-west of Blackall in the southern Galilee Basin, and around the north-eastern margin of the GAB in the vicinity of Hughenden.
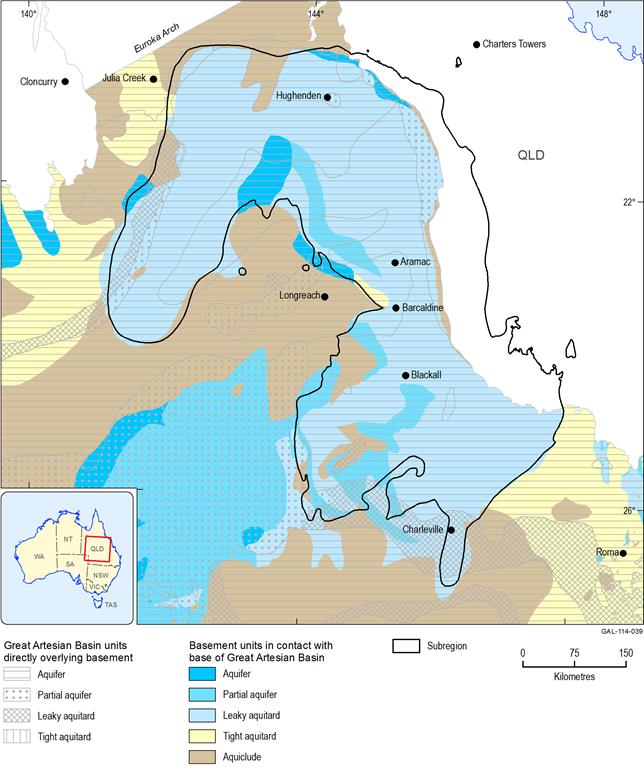
Source data: after Figure 5.8, Smerdon and Ransley (2012).
