Figure 12 shows the hydrological changes to the annual flow (AF) at each receptor. For the receptors in the northern part of the subregion, the biggest impact occurs at node 14 (Dog Trap Creek), where the median pmax is –15%. That is, of the reductions in streamflow between the baseline and CRDP from the 1000 replicates, the median (~500th) of the predicted maximum changes is 15%. There is a tightly constrained distribution of pmax values around this median value. The year in which this maximum change occurs is 2030 for almost all replicates. The 15% median reduction in streamflow corresponds with a reduction of about 3.2 GL below the median baseline streamflow of 22 GL for that year. This raw change propagates downstream through nodes 11 and 6 on the Avon River and nodes 4 and 2 on the Gloucester River, all of which have median tmax values in the same year. However, the median pmax reductions get smaller downstream as the change from node 11 is diluted by further tributary inflows. There are also smaller reductions in pmax of less than 2% at nodes 16, 12 and 9, but negligible or no impact at nodes 3, 5, 7, 8, 10, 13, 15 and 17.
For all the receptors in the southern part of the subregion, the maximum impact is less than 1% of baseline flow. Node 21 has an absolute reduction in annual flow of 0.6 GL with a median tmax of 2079. This reduction is maintained at a similar order of magnitude in all nodes downstream of node 21. There is substantial variability in predicted tmax throughout the southern nodes, but for those nodes downstream of node 21, the median typically occurs around 2050, reflecting the lagged groundwater response and different climate conditions.
Node 14 is immediately downstream of the Stratford Mining Complex (Figure 5 in Section 2.6.1.3), which has the largest additional coal resource development footprint in the Gloucester subregion (Figure 7 in Section 2.6.1.3). The percentage increase in additional coal resource development footprint (18%) and year of maximum additional coal resource development footprint (2026) in Table 4 in Section 2.6.1.3 are commensurate with the predicted impact and timing of maximum AF change. Nodes 9 and 12 are downstream of the proposed Rocky Hill Coal Mine and their early median tmax values reflect the early peak in additional coal resource development footprint at that mine.
The uncertainty in tmax in nodes in the Karuah river basin result from the Duralie Coal Mine maintaining its maximum additional coal resource development footprint throughout the period 2018 to 2102.
The tightly constrained changes in pmax at most nodes suggests that the biggest impact on AF is caused by interception and retention of surface runoff at the mine sites, rather than by reduced baseflows associated with groundwater drawdown. The impact of any drawdown associated with the Gloucester CSG field is not readily discernible, though most nodes nearby are either affected by mine impacts or are only on the fringes of the CSG field.
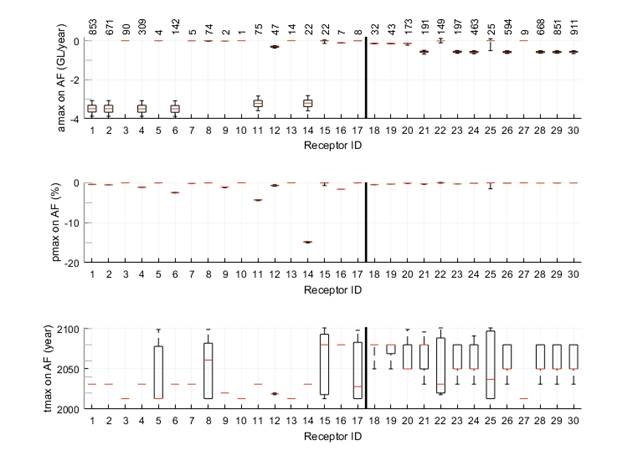
Numbers above the top panel are the median of the best 1000 replicates under the baseline for the year corresponding to the median tmax. In each boxplot, the bottom, middle, and top of the box are the 25th, 50th, and 75th percentiles, and the bottom and top whiskers are the 5th and 95th percentiles. The thick black line divides receptors in the northern part of the subregion (receptors 1–17) from those in the southern part (receptors 18–30).
amax = maximum raw change, pmax = maximum percent change and tmax = year of maximum change
Data: Bioregional Assessment Programme (Dataset 1)
Figure 13 shows the hydrological changes to P99 at each receptor. Again, the biggest change in pmax occurs at node 14, where there is a reduction of about 15%, which corresponds to a median amax reduction of about 300 ML/day. The median tmax occurs in 2030. In most respects, the pattern of change in P99 is the same as that in AF, with small impacts at nodes 9, 12 and 16, and with the impacts from these three and node 14 being translated through downstream nodes. There is negligible percentage change in the nodes in the southern part of the subregion.
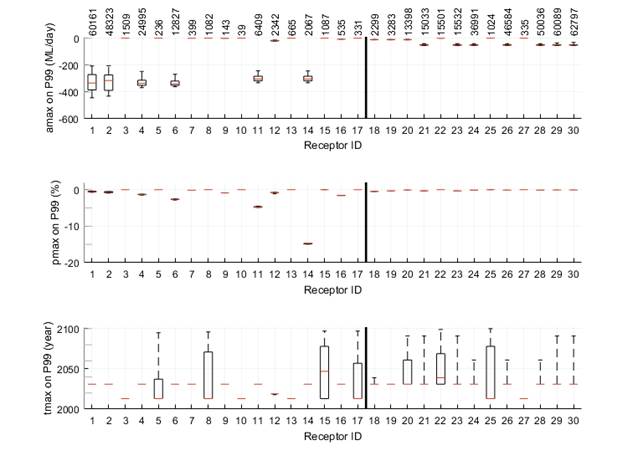
Numbers above the top panel are the median of the best 1000 replicates under the baseline for the year corresponding to the median tmax. In each boxplot, the bottom, middle, and top of the box are the 25th, 50th, and 75th percentiles, and the bottom and top whiskers are the 5th and 95th percentiles. The thick black line divides receptors in the northern part of the subregion (receptors 1–17) from those in the southern part (receptors 18–30).
amax = maximum raw change, pmax = maximum percent change and tmax = year of maximum change
Data: Bioregional Assessment Programme (Dataset 1)
Figure 14 shows the hydrological changes to the interquartile range (IQR) at each receptor. The patterns of change are similar to those of AF (Figure 1 2) and P99 (Figure 13). The biggest percentage change in IQR is a median reduction of 17% in 2027 at node 14.
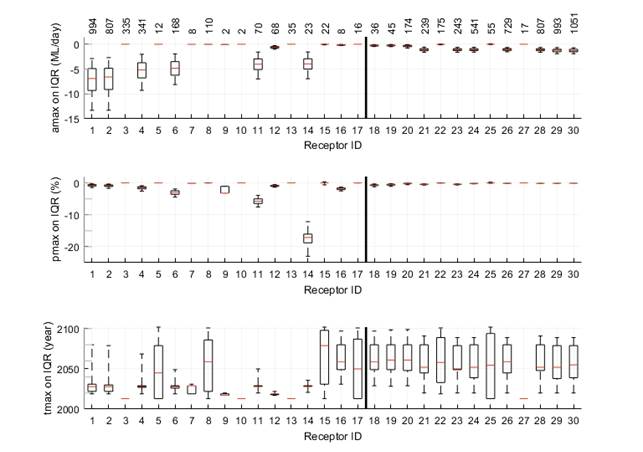
Numbers above the top panel are the median of the best 1000 replicates under the baseline for the year corresponding to the median tmax. In each boxplot, the bottom, middle, and top of the box are the 25th, 50th, and 75th percentiles, and the bottom and top whiskers are the 5th and 95th percentiles. The thick black line divides receptors in the northern part of the subregion (receptors 1–17) from those in the southern part (receptors 18–30).
amax = maximum raw change, pmax = maximum percent change and tmax = year of maximum change
Data: Bioregional Assessment Programme (Dataset 1)
Figure 15 shows the hydrological changes to FD at each receptor. There is a noticeable decrease (>1 day) for the maximum change in FD at some northern receptors. The largest decrease is predicted at receptor 14 where the amax on FD at the median of the 1000 replicates and at the maximum impact time is nine days. This change propagates downstream but with reduced impact. At node 1, the predicted decrease in FD is just one day. There are median reductions in amax of three and four days at nodes 9 and 16, respectively. Compared to AF, P99 and IQR, there is greater uncertainty in tmax for FD at the nodes with significant impact. The median tmax remains in the period around 2030 or earlier at and downstream of node 14, but occurs in 2049 at node 16.
The amax on FD for all southern receptors is less than two days, with tmax values being very uncertain.
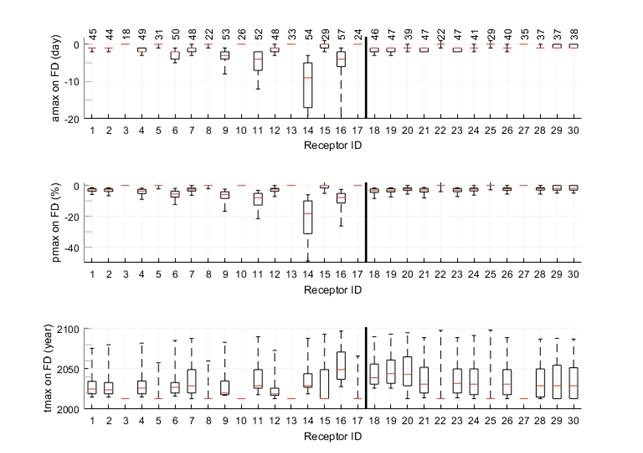
Numbers above the top panel are the median of the best 1000 replicates under the baseline for the year corresponding to the median tmax. In each boxplot, the bottom, middle, and top of the box are the 25th, 50th, and 75th percentiles, and the bottom and top whiskers are the 5th and 95th percentiles. The thick black line divides receptors in the northern part of the subregion (receptors 1–17) from those in the southern part (receptors 18–30).
amax = maximum raw change, pmax = maximum percent change and tmax = year of maximum change
Data: Bioregional Assessment Programme (Dataset 1)
The remaining boxplots characterise the changes for the low-streamflow hydrological response variables. Figure 16 shows the hydrological changes to daily streamflow at P01 at each receptor. At the 25th percentile, the most significant reductions occur at nodes 9, 12 and 14, which are all on small tributaries of the Avon River. The respective 25th percentile pmax values are –27%, –47% and –41%. However, in each case these large percentage changes are generated from already quite small values of baseline P01 and only node 14 shows significant impact at the median (–17%). A small minority of replicates at some nodes (e.g. node 14) predict small increases in P01. The tmax values for the most heavily impacted nodes vary greatly, but for node 14, the median tmax is as late as 2069.
The amax and pmax at receptors located within the southern part of the subregion are negligible. The additional coal resource development causes reductions at P01 of less than 1% in all southern receptors.
By comparison to the three flux-based high-flow hydrological response variables (AF, IQR and P99), P01 tends to have greater uncertainty – as shown by a large interquartile range relative to the median response – for both pmax and tmax.
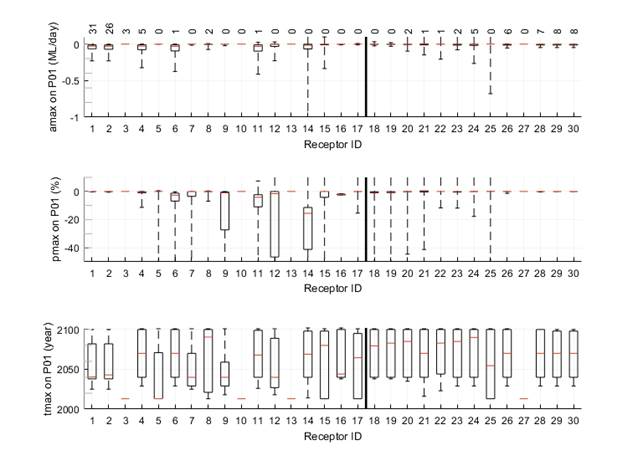
Numbers above the top panel are the median of the best 1000 replicates under the baseline for the year corresponding to the median tmax. In each boxplot, the bottom, middle, and top of the box are the 25th, 50th, and 75th percentiles, and the bottom and top whiskers are the 5th and 95th percentiles. The thick black line divides receptors in the northern part of the subregion (receptors 1–17) from those in the southern part (receptors 18–30).
amax = maximum raw change, pmax = maximum percent change and tmax = year of maximum change
Data: Bioregional Assessment Programme (Dataset 1)
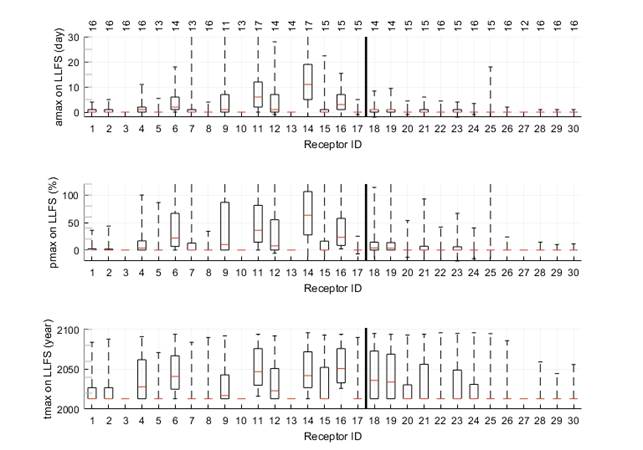
Figure 17 shows the increases in LFD caused by the additional coal resource development. In the northern part of the subregion, the median amax on LFD is predicted to increase by 12 days at receptor 14 and by at least four days at receptors 11 and 16. There is considerable uncertainty in the corresponding tmax values, but the median tmax values at node 14 occurs in 2032. Only nodes 3, 10 and 13 are unaffected in the northern part of the subregion.
In the southern part of the subregion, the changes on LFD are smaller, with the biggest impacts occurring at receptor 18, with a median amax value of two days. This node is not downstream of any coal mines, so the changes in LFD must be associated with reduced baseflow from groundwater drawdown generated from either the expansion of the Stratford Mining Complex or the proposed Gloucester Gas Project stage 1.
Numbers above the top panel are the median of the best 1000 replicates under the baseline for the year corresponding to the median tmax. In each boxplot, the bottom, middle, and top of the box are the 25th, 50th, and 75th percentiles, and the bottom and top whiskers are the 5th and 95th percentiles. The thick black line divides receptors in the northern part of the subregion (receptors 1–17) from those in the southern part (receptors 18–30).
amax = maximum raw change, pmax = maximum percent change and tmax = year of maximum change
Data: Bioregional Assessment Programme (Dataset 1)
Figure 18 shows the hydrological changes on LFS. The patterns of change in LFS are similar to those for LFD. In the northern part of the subregion, there is a median increase in low-flow spells of up to two spells per year (node 14). There are median increases of one spell per year at nodes 6, 11 and 16. At the 50th percentile, there are no changes to the number of low-flow spells per year in the southern part of the subregion.
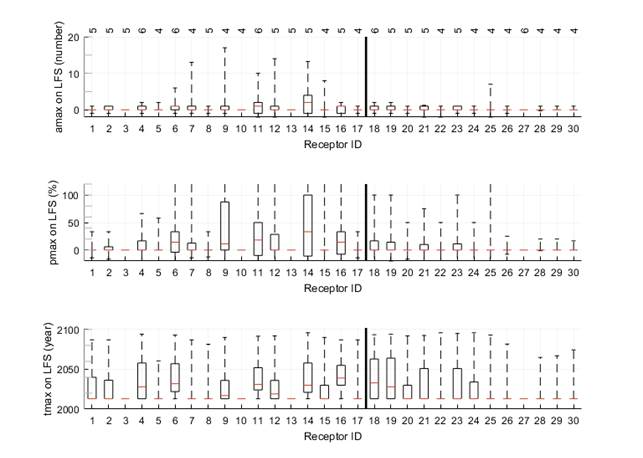
Numbers above the top panel are the median of the best 1000 replicates under the baseline for the year corresponding to the median tmax. In each boxplot, the bottom, middle, and top of the box are the 25th, 50th, and 75th percentiles, and the bottom and top whiskers are the 5th and 95th percentiles. The thick black line divides receptors in the northern part of the subregion (receptors 1–17) from those in the southern part (receptors 18–30).
amax = maximum raw change, pmax = maximum percent change and tmax = year of maximum change
Data: Bioregional Assessment Programme (Dataset 1)
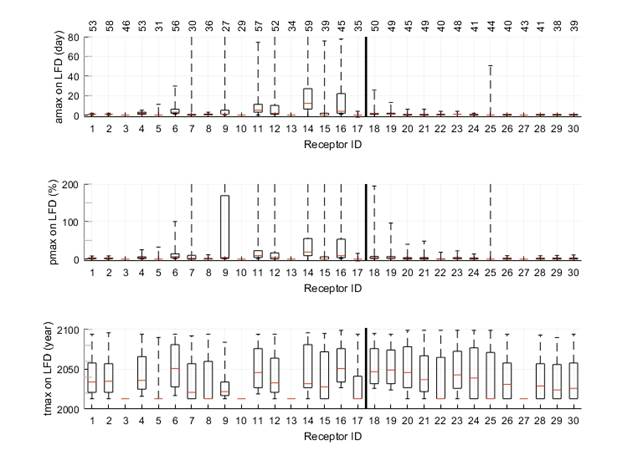
Figure 19 shows the maximum changes to the length of the longest annual low-flow spell (LLFS). The changes in LLFS are very similar to those in LFS and those in LFD. In the northern part of the subregion, the median increase in LLFS is 11 days at node 14, six days at node 11 and three days at node 16. There is a 25% chance that the maximum LLFS will increase by 19 days at node 14. The median tmax occurs in 2041. The median LLFS increases by no more than one day at any node in the southern part of the subregion.
Numbers above the top panel are the median of the best 1000 replicates under the baseline for the year corresponding to the median tmax. In each boxplot, the bottom, middle, and top of the box are the 25th, 50th, and 75th percentiles, and the bottom and top whiskers are the 5th and 95th percentiles. The thick black line divides receptors in the northern part of the subregion (receptors 1–17) from those in the southern part (receptors 18–30).
amax = maximum raw change, pmax = maximum percent change and tmax = year of maximum change
Data: Bioregional Assessment Programme (Dataset 1)
