Figure 9 summarises regional model calibration results for the 16 catchments. The bottom, middle and top of each box represent the 25th, 50th and 75th percentiles, and the bottom and top whiskers represent the 10th and 90th percentiles. For both high-streamflow and low-streamflow calibrations, three metrics (F value, daily efficiency and model bias) are shown and their details are introduced in the Figure 9 notes. The high-streamflow calibration yields a good Nash–Sutcliffe efficiency of daily streamflow (Ed(1.0)) and low model bias, indicated by a median Ed(1.0) of 0.67 and a median bias of –0.04.
Table 5 shows the Ed(1.0) and bias for each catchment. For the four catchments contributing surface water to the Gloucester subregion, the Ed(1.0) is 0.67, 0.57, 0.59 and 0.67 for the catchments 208006, 208020, 209002 and 209018 respectively; their respective biases are –0.31, 0.15, 0.07 and 0.08.
The low-streamflow calibration is evaluated against the daily streamflow data transformed with a power of 0.1, or a Box-Cox lambda value of 0.1 (Box and Cox, 1964), which allows the calibration to put more weight on low streamflows than would occur with a higher Box-Cox lambda. The low-streamflow calibration yields overall good efficiency with the Box-Cox lambda value of 0.1, indicated by a median Ed(0.1) of 0.65. The Ed(0.1) is 0.73, 0.75, 0.27 and 0.78 for the catchments 208006, 208020, 209002 and 209018 respectively; their respective biases are –0.27, 0.16, 0.20 and 0.08.
It is noted that the 16 calibration catchments cover a wide range of climatic and topographic conditions, where mean annual streamflow varies from 100 mm/year at catchment 210080 to 507 mm/year at catchment 208006 (Table 5). The good performance for both high-streamflow and low-streamflow calibrations indicates that the AWRA-L model can predict streamflow well in the Gloucester subregion and its surrounding areas where climate conditions vary widely.
The performance of the high-streamflow calibration for the 16 catchments appears to be independent of catchment wetness, as it does not perform better with a wetter climate. However, the performance of the low-streamflow calibration becomes significantly (p < 0.1) better when the catchment becomes wetter, as indicated by a coefficient of determination of 0.18 between mean annual streamflow and Ed(0.1) for the 16 catchments.
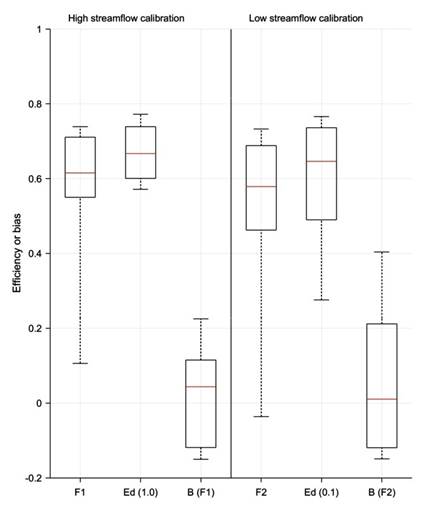
Figure 9 Summary of two AWRA-L model calibrations for the Gloucester subregion
Left: high-streamflow calibration; right: low-streamflow calibration. In each boxplot, the bottom, middle and top of the box are the 25th, 50th and 75th percentiles, and the bottom and top whiskers are the 10th and 90th percentiles. F1 is the F value for high-streamflow calibration; F2 is the F value for the low-streamflow calibration; Ed(1.0) is the daily efficiency with a Box-Cox lambda value of 1.0; Ed(0.1) is the daily efficiency with a Box-Cox lambda value of 0.1; B is model bias (Viney, 2016).
AWRA-L = Australian Water Resource Assessment Landscape
Data: Bioregional Assessment Programme (Dataset 1); NSW Office of Water (Dataset 3)
Table 5 Summary of model calibration for the 16 catchments for the Gloucester subregion
aF1 is the F value for high-streamflow calibration (see Viney, 2016).
bF2 is the F value for low-streamflow calibration (see Viney, 2016).
Data: Bioregional Assessment Programme (Dataset 1); NSW Office of Water (Dataset 3)
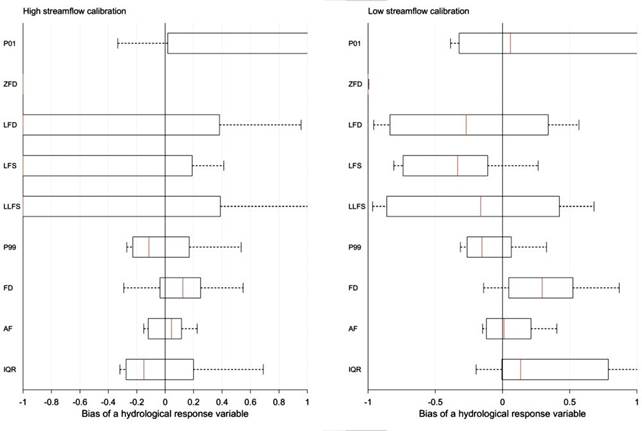
Figure 1 0 shows the performance of the two calibration schemes (high-streamflow calibration and low-streamflow calibration) for predicting the nine hydrological response variables (their details shown in Table 4). The high-streamflow calibration yields very good predictions on high-streamflow metrics – annual flow and interquartile range – indicated by very narrow interquartile ranges in model bias and by the median bias approaching zero. The high-streamflow calibration predicts P01 poorly, with an overestimate in the majority of catchments (see annual streamflow boxplot). It predicts other low-streamflow metrics even worse, such as zero-flow days, low-flow days, low-flow spells, and the longest low-flow spell for most catchments, and the bias for these hydrological response variables is –1 for the majority of catchments. This indicates the high-streamflow calibration almost always overestimates low streamflow. This is expected as the high-streamflow calibration puts more weight for simulating high streamflow and less weight for simulating low streamflow.
Table 6 Summary of nine hydrological response variables (HRVs)
Compared to the high-streamflow calibration, the low-streamflow calibration noticeably improves predictions on P01 and other low-streamflow metrics. It estimates P01 with a median bias of 0.06. It slightly underestimates low-flow days, low-flow spells, and length of the longest low-flow spells, with the median biases being –0.27, –0.33 and –0.16 respectively.
The low-streamflow calibration yields slightly poorer predictions on P99 and flood days, with the median bias being –0.15 and 0.30, respectively. The low-streamflow calibration, however, is slightly better than the high-streamflow calibration, with a median bias approaching zero. A slight overestimate on interquartile range is obtained from the low-streamflow calibration, in contrast to the underestimate obtained from the high-streamflow calibration.
Neither model calibration scheme predicts zero-flow days well. This is because streamflow at the gauge sites in most of the catchments is perennial and the observed annual number of zero-flow days (ZFD) is zero. As stated by Viney (2016), it is expected that for most receptors, the variables P01 and ZFD will be mutually exclusive in that one or the other will produce useful information, but not both. In the Gloucester subregion, ZFD is unlikely to provide useful predictions in most receptors and is not carried forward as an hydrological response variable into the predictions and uncertainty sections.
Boxplots are obtained from the statistics (Nash–Sutcliffe efficiency and bias) results at the 16 calibration catchments. In each boxplot, the left, middle, and right of the box are the 25th, 50th, and 75th percentiles, and the left and right whiskers are the 10th and 90th percentiles.
AWRA-L = Australian Water Resource Assessment Landscape
Data: Bioregional Assessment Programme (Dataset 1); NSW Office of Water (Dataset 3)
The calibration results obtained from Figure 9 and Figure 10 indicate that the high-streamflow calibration is sufficient for predicting P99, annual flow and interquartile range, and the low-streamflow calibration is suitable for predicting P01. The low-streamflow calibration, however, is much better than the high-streamflow calibration for predicting the hydrological response variables reflecting low-streamflow metrics, including low-flow days, low-flow spells, and length of the longest low-flow spells.
