The objective is to choose the set of global climate model (GCM) seasonal scaling factors that give the median change in mean annual precipitation in the Gloucester subregion. There are 15 available GCMs with seasonal scaling factors for each of the four seasons: summer (December–February), autumn (March–May), winter (June–August) and spring (September–November).
For each GCM the change in mean seasonal precipitation that is associated with a 1 °C global warming is calculated. These seasonal changes are then summed to give a change in mean annual precipitation. Scaling factors for the AR4 emissions scenario A1B (IPCC, 2007) are used.
The resulting changes in mean annual precipitation for a 1 °C global warming in the Gloucester subregion are shown in Table 3 for each GCM. The 15 GCMs predict changes in mean annual precipitation ranging from –5.4% (i.e. a reduction in mean annual precipitation) to 6.7% (i.e. an increase in mean annual precipitation). The GCM with the median change is CSIRO-Mk3.0. The corresponding projected change in mean annual precipitation per degree of global warming is a reduction of 0.4%, or about 4.5 mm. The seasonal scaling factors for CSIRO-Mk3.0 are +4.5%, –2.1%, –4.5% and –2.8% for summer, autumn, winter and spring, respectively. In other words, projected increases in precipitation in the wettest season, summer, are offset by projected decreases in the other three seasons.
Table 3 List of 15 global climate models (GCM) and their predicted change in mean annual precipitation across the Gloucester subregion per degree of global warming
Data: CSIRO (Dataset 5)
The seasonal scaling factors associated with CSIRO-Mk3.0 are used to generate trended climate inputs for the years 2013 to 2102. The trends assume global warming of 1 °C for the period 2013 to 2042, compared to 1983 to 2012. The global warming for 2043 to 2072 is assumed to be 1.5 °C and the corresponding scaling factors for this period are therefore multiplied by 1.5. The global warming for 2073 to 2102 is assumed to be 2 °C.
The scaling factors are applied to scale the daily precipitation in the climate input series that is generated for 2013 to 2102. The resulting annual precipitation time series for the Gloucester subregion is shown in Figure 6. It depicts a cycle of 1983 to 2012 climate that is repeated a further three times but with increasingly trended climate change scalars. It can be seen from Figure 6 that the decrease in precipitation from 2013 to 2102 is less than the typical interannual variability. Furthermore, it reduces annual precipitation rates to levels that remain much higher than were typically encountered in the first half of the 20th century.
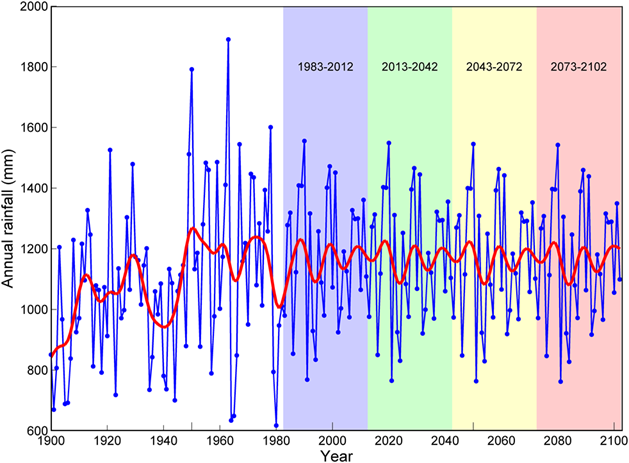
Data: Bioregional Assessment Programme (Dataset 6)
