The protracted geological history of deposition, deformation, uplift, and erosion that has occurred in the Galilee subregion has implications for the degree of connectivity that may exist between various geological units, coal resource development and water-dependent assets. Examples of water-dependent assets that are of interest to a BA include: aquifers, water supply bores, groundwater-dependent ecosystems, springs, surface water-dependent ecosystems and rivers.
2.3.2.2.1 Geology
Aspects of the geological history and geological framework are outlined in Figure 6 and Section 2.1.2 in companion product 2.1-2.2 for the Galilee subregion (Evans et al., 2018; also companion product 1.1 (Evans et al., 2014)). Other summaries of the geological history for individual basins included within the subregion include Cook et al. (2013) and McKellar and Henderson (2013). A brief overview of the geological history is as follows:
- The Galilee Basin sequence lies unconformably on much older rocks that belong to the North Australian Craton and Thomson Orogen, as well as sedimentary rocks of the Drummond, and Adavale basins. Deposition in the Galilee Basin was initiated in the Koburra Trough. It then progressively spread into other depositional centres such as the Powell and Lovelle depressions. A major erosional event occurred after the cessation of deposition of the very thick Upper Carboniferous to lower Permian Joe Joe Group sequence (average thickness 466 m). Above this significant unconformity, the Galilee Basin sequence comprises the upper Permian coal measures, and Early to Middle Triassic Rewan Group, Clematis Group and the Moolayember Formation. Average thickness for these units are 93 m, 148 m, 117 m and 182 m, respectively (Evans et al., 2018). In these upper sequences, unconformities of lesser magnitude occur at the end of the Permian and at the end of the Early Triassic.
- The Early Jurassic to Late Cretaceous Eromanga Basin constitutes most of the cover over the Galilee Basin. A significant hiatus of approximately 65 million years separated cessation of deposition in the Galilee Basin and initiation of the Eromanga Basin. In the Galilee subregion, the Eromanga Basin sequence is thickest in the Powell and Lovelle depressions (up to 1800 m), which suggests that these regions continued as depocentres during the Jurassic-Early Cretaceous, in contrast to the Koburra Trough, which had ceased active subsidence.
- Exposed and subsurface extents of Cenozoic sediments are scattered across the Galilee subregion as remnants of isolated lacustrine, spring and fluvial depositional events. These remnants of small depocentres have unique depositional histories, although there may be some similarities in timing of depositional events. Basaltic volcanics occur around the north-eastern margin of the Galilee subregion (see Figure 13 in Section 2.1.2.2.5 of companion product 2.1-2.2 (Evans et al., 2018)). The youngest alluvial sediments are associated with current drainage. The Cenozoic sediments, while a thin cover of the much bigger Galilee and Eromanga geological sequences, are a crucial interface between groundwater systems in underlying aquifers and surface water systems.
Figure 7, Figure 8, and Figure 9 show some of the features of the geological architecture demonstrated by the Galilee subregion geological model (see companion product 2.1-2.2 for the Galilee subregion (Evans et al., 2018)). The locations of the cross-sections are shown in Figure 6.
Figure 7 is a north-east oriented cross-section through the central portion of the Galilee subregion. It shows the faulted nature of the western margin of the Galilee Basin, with fault movement along the Hulton-Rand structure offsetting the Galilee Basin sequences against the Maneroo Platform. Figure 7 also shows how Moolayember Formation thins near the western margin of the Galilee Basin allowing direct contact between the Clematis Group, and the overlying Hutton Sandstone, which is a part of the Eromanga Basin.
Outcrop of Hooray and Hutton sandstones forms a prominent ridge that demarcates the eastern margin of the Eromanga Basin. The broad topographic high is apparent between the margin of Eromanga Basin and the Great Dividing Range, and includes the closed basins that encompass lakes Buchanan and Galilee. Carmichael and China Stone coal projects are situated on the eastern flank of the Great Dividing Range.
Prominent in Figure 8 is a fault block associated with the Barcaldine Ridge. Here, an up-thrown block of Joe Joe Group sedimentary rocks abuts against Triassic-aged sedimentary rocks of the Galilee Basin (Rewan Group, Clematis Group and Moolayember Formation). The Barcaldine Ridge fault blocks demarcate the boundary between the northern and southern Galilee Basin. Also apparent is the significant thickness of Eromanga Basin strata that occurs in the southern Galilee Basin.
Figure 9 is a north-easterly cross-section through the southern Galilee Basin and the Powell Depression. Most of the Galilee Basin sequence is missing in the Powell Depression with much of the infill comprising sedimentary rocks of the Eromanga Basin. As with Figure 7, it is apparent that two sub-parallel ridges along the eastern margin form the most prominent topographic high in the Galilee subregion.
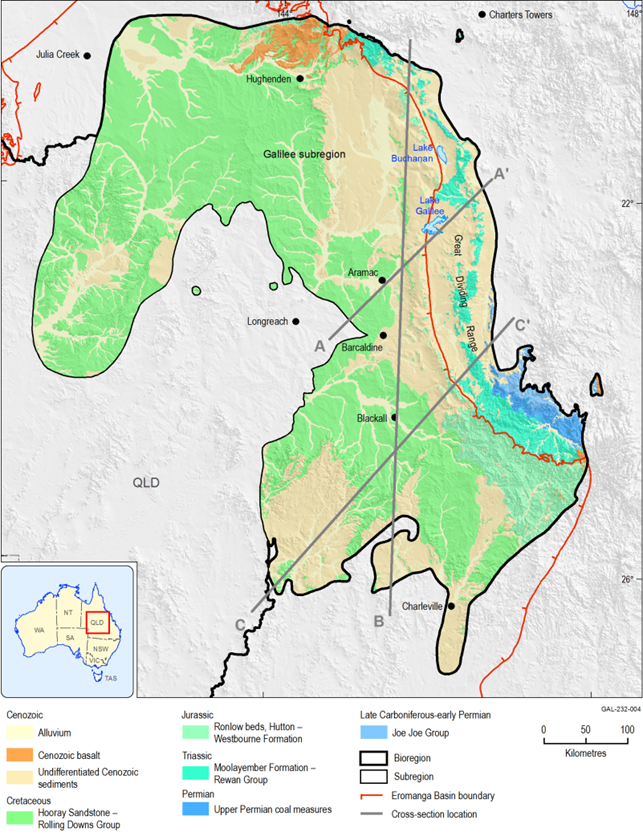
Figure 6 Surface geology of the Galilee subregion and location of geological cross-sections
Cross-sections A to A’, B to B’ and C to C’ are shown in Figure 7, Figure 8 and Figure 9, respectively.
Data: Geoscience Australia (Dataset 1, Dataset 2)
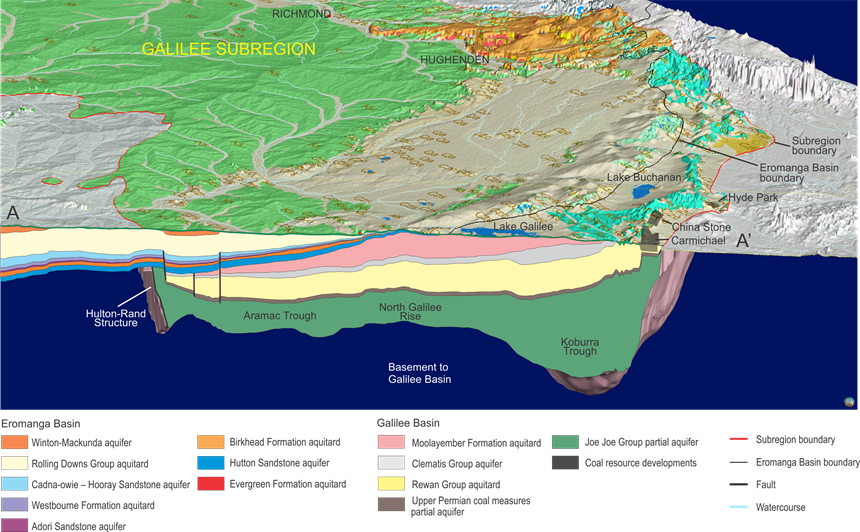
The cross-section represents a slice through Galilee subregion three dimensional geological model (Evans et al., 2018) along a line. Location of geological cross-section line is shown in Figure 6.
The legend in this figure only applies to the cross-section. The legend for the surface geology is outlined in Figure 6.
Data: Bioregional Assessment Programme (Dataset 3)
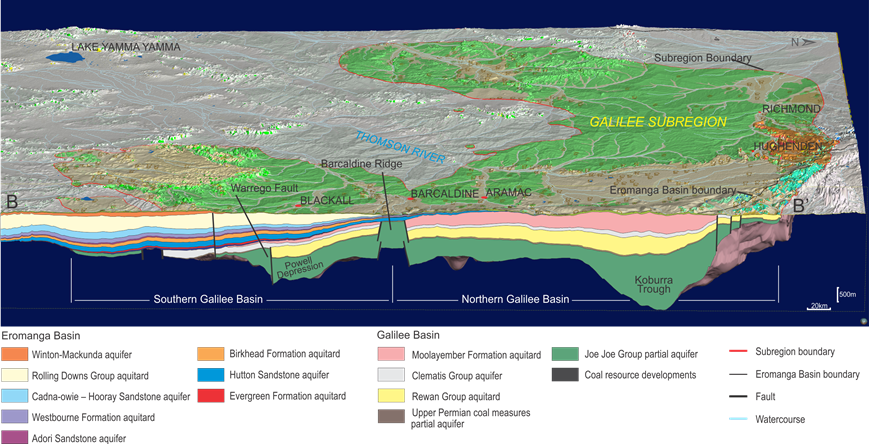
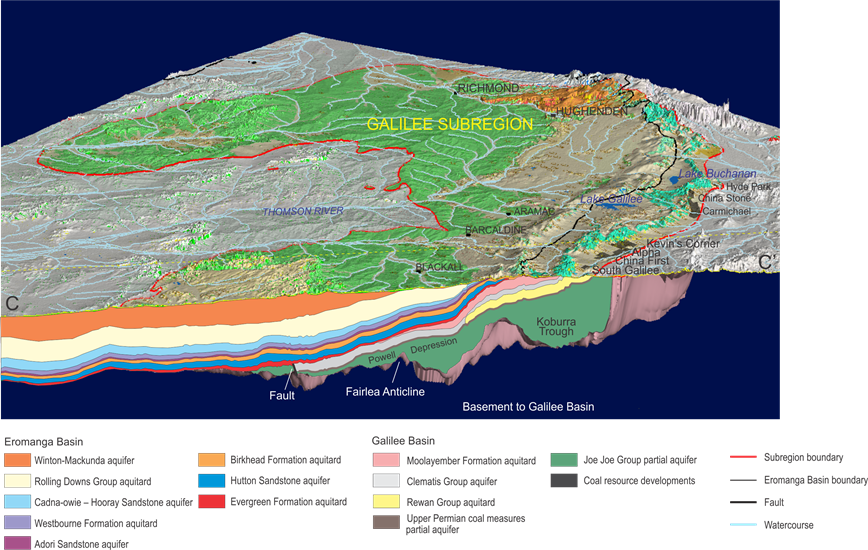
2.3.2.2.1.1 Overburden thickness to the upper Permian coal measures
The upper Permian coal measures are the primary target for CSG and coal mining development in the Galilee subregion. Overburden thickness is one of several significant factors that affect the degree of connectivity between aquifers that may occur in the coal measures and water-dependent assets. The overburden or cover to the upper Permian coal measures is the combined thickness of the Cenozoic sediments, Eromanga Basin sequence, and the Moolayember Formation, Clematis Group and Rewan Group of the Galilee Basin (Figure 10).
Outcrop of upper Permian coal measures occurs along the eastern margin of the Galilee subregion. Westwards from the outcrop areas, overburden thickens to over 500 m. The only area of relatively thin overburden away from the eastern margin of the subregion is in the vicinity of the Barcaldine Ridge, where the overburden thins to considerably less than 400 m. On the Barcaldine Ridge overburden to the upper Permian coal measures consists almost entirely of Eromanga Basin strata, which in turn is overlain by a thin veneer of Cenozoic sediments.
It is apparent from Figure 10 that the Barcaldine Ridge is rather complex and consists of at least two blocks that trend in an easterly direction away from the western margin of the Galilee Basin. On the westernmost block, the upper Permian coal measures have been eroded away exposing a ridge of geological basement rocks that protrudes eastwards into the Galilee Basin sequence. The second block is situated immediately to the south-east of Barcaldine township. This block is defined by the area where the overburden thins significantly to less than 400 m. In this area the whole sequence of Triassic aged sedimentary rocks (Rewan Formation to Moolayember Formation sequence) is missing and has presumably been eroded away. Erosion of the Triassic aged sequence would have been facilitated by upward movement of the fault-bound block that underlies this segment of the upper Permian coal measures. A cross-section (Figure 8) through the second (easternmost) block that defines the Barcaldine Ridge suggests that the amount of apparent offset that has occurred along the faults that define the boundaries of this block is in the order of 500 m. Overburden thickness contours (Figure 10) suggest that the influence of Barcaldine Ridge structures diminishes eastwards of the second block and is not apparent near the eastern margin of the Galilee subregion.
Much of the overburden cover comprises the Eromanga Basin sequence. In the Galilee subregion, the Eromanga Basin sequence is thickest in the Powell and Lovelle depressions (up to 1800 m), which suggests that these regions continued to act as depocentres during the Jurassic-Early Cretaceous. This is in contrast to the Koburra Trough, which had ceased active subsidence by this period.
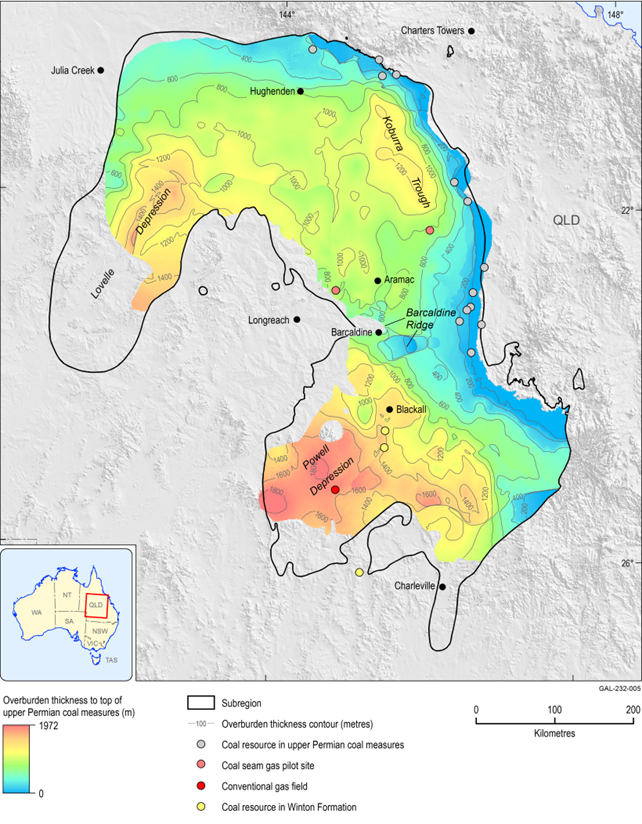
Figure 10 Thickness of sedimentary cover above the upper Permian coal measures
Data Bioregional Assessment Programme (Dataset 4), Geoscience Australia (Dataset 5), Bureau of Meteorology (Dataset 6)
2.3.2.2.1.2 Potential basin connectivity
Of prime interest towards understanding groundwater and hydrocarbon movement is the identification of potential connectivity of aquifers between different geological basins, and ultimately connectivity of underlying aquifers with surface alluvial aquifers. Understanding the connection of aquifers with deeper basins helps identify potential pathways for fluid migration.
The greatest potential for connectivity can be through the direct contact of aquifers in each basin, either through overlap of their stratigraphic extent, or from their juxtaposition along faults. Fault zones can potentially be either conduits or barriers to groundwater movement (Bense et al., 2013).
Potential connectivity between Galilee and Eromanga basins
The Galilee subregion geological model demonstrates that, in some areas there is direct contact between major aquifers in the Eromanga Basin (e.g. Hutton Sandstone aquifer) and the Clematis Group aquifer and upper Permian coal measures in the underlying Galilee Basin.
The Moolayember Formation, an aquitard of variable hydraulic character, is either thin or absent near the western margins of the Galilee Basin (Figure 11; see also Figure 16 in companion product 2.1-2.2 for the Galilee subregion (Evans et al., 2018)), enabling aquifer contact between basins. The Rewan Group, the next aquitard down-sequence in the Galilee Basin, extends an effective sealing cover westwards towards the Maneroo Platform (Figure 11). The combined extent of these aquitards is limited to the south-west, and enables a large area of aquifers in the Galilee Basin sequence to abut the Eromanga Basin sequences on three sides of the Maneroo Platform.
Small areas of Clematis Group aquifer are in direct contact with overlying Hutton Sandstone or Precipice Sandstone aquifer (Eromanga Basin) in the vicinity of the Maneroo Platform (to the north-west of Barcaldine) and near the southern margin of the Galilee Basin, south of Blackall.
Large areas of upper Permian coal measures partial aquifer as well as the deeper Joe Joe Group partial aquifer are also in direct contact with the base of the Eromanga Basin across parts of the southern Galilee Basin, in a narrow zone adjoining the Maneroo Platform along the western margin of the Galilee subregion (north-west of Barcaldine). Here, the Joe Joe Group and upper Permian coal measures partial aquifer are overlain predominantly by the Hutton Sandstone aquifer. A thin zone of deeper Galilee aquifers (Joe Joe Group) along the north-western edge of the Galilee subregion (south of Julia Creek) are in direct contact with the Cadna-owie – Hooray aquifer and Hutton Sandstone aquifer. In the southern Galilee subregion, the above mentioned Galilee Basin sequences are in contact with the Precipice Sandstone aquifer.
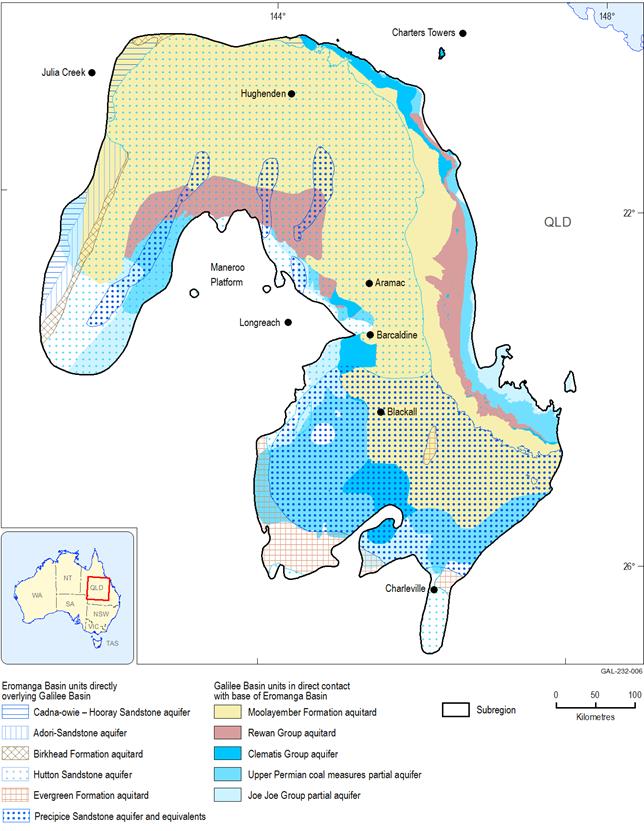
Figure 11 Areas of potential hydraulic connectivity between the Galilee and Eromanga basins
Potential areas of inter-aquifer connectivity may occur particularly in areas where the Rewan Group and Moolayember Formation are missing from underneath the Eromanga Basin in the Galilee subregion. This would allow potentially more permeable sequences, such as Clematis Group, upper Permian coal measures and Joe Joe Group, to be in direct contact with the base of the Eromanga Basin.
Data: Bioregional Assessment Programme (Dataset 3, Dataset 7), Geoscience Australia (Dataset 8)
Potential for structural connectivity within the Galilee and Eromanga basins
Marsh et al. (2008) noted that, on a regional scale, stratigraphic sequences in the Galilee Basin and overlying areas of the Eromanga Basin appear to be relatively free from structural overprint. Research since 2008 has improved knowledge of the geological structure and its complexity. For example, there is faulting associated with the Barcaldine Ridge (Figure 8, Figure 10) and recent work outlined in Comet Ridge Ltd (2016) has improved structural understanding of deeper parts of the Galilee Basin. The structural style of the southern Galilee Basin differs from the northern parts in that it has extensive subtle folding inherited from underlying structural deformation associated with inversion of the Adavale Basin.
It is difficult to make a general categorisation about the hydraulic characteristics of faults, whether they may be a potential conduit or a barrier (or have little effect), as their effects on the groundwater flow regime are commonly poorly understood (Moya et al., 2014; Bense et al., 2013). This can depend on a number of factors including fault orientation, fault type and movement history, amount of offset, the present day stress regime, and type of fault infill. Faults can act as barriers if they juxtapose an aquifer against an aquitard or if the faults are filled with significant amounts of clay gouge. Alternatively, faults can act as conduits if there is sufficient fracture connectivity or if a fault is orientated favourably with regards to the present-day stress regime.
Major faults do occur in the Galilee subregion (e.g. Figure 7, Figure 8, and Figure 9) The Cork Fault has had vertical displacement in the Cenozoic with locally up to 420 m displacement at the base of Eromanga sequence (Ransley et al., 2015). Aside from the Holberton-Cork-Wetherby fault structures in the Lovelle Depression, it appears that many of the more significant faults occur near the margins of the Galilee subregion, in particular the western margin adjoining the Maneroo Platform. Many faults here are reactivated basement reverse faults such as the Hulton-Rand and Tara structures, which have had vertical displacement during the Paleozoic and Mesozoic and were generally syn-depositional with basin sequences (Vine et al., 1965; Moya et al., 2014). At present, vertical displacement on some of these features (at top of Hutton Sandstone) ranges from 350 m (Hulton-Rand Structure), 265 m (Tara Structure), 165 m (Maranthona Monocline) and 50 to 120 m (Darriveen, Longreach and Corfield faults on basement over the Maneroo Platform). The Maranthona Monocline apparently ceased movement after Cadna-owie Formation deposition in the Early Cretaceous (Moya et al., 2014). For further detail on structures see Section 2.1.2.3.3 in companion product 2.1-2.2 for the Galilee subregion (Evans et al., 2018).
Most fault activity in the Galilee Basin occurred during the early Permian and late Permian, and thus mainly affected the Joe Joe Group. Up-sequence in and above the upper Permian coal measures, tectonic activity and disruption was minimal to absent. Many other faults do not extend far up sequence from basement, but instead may transition upwards into folds. Upper Permian coals overlying faults in the Aramac Depression at Rodney Creek are not displaced; however, they are known to be folded with increased cleat development along this structure (Bradshaw et al., 2009). One exception may be faulting associated with the Barcaldine Ridge structures. Continued fault movement along these structures has resulted in Triassic-aged sequences being eroded from across the Barcaldine Ridge.
Polygonal faulting is widespread in the Cretaceous Rolling Downs Group aquitard and the Winton-Mackunda aquifer across the subregion (Ransley et al., 2015). Although this faulting is intraformational within finer-grained rocks and with displacement up to 60 m, it generally terminates against thick sandstone beds within these hydrostratigraphic units. Polygonal faults, however, commonly reinitiate upwards from the top of these aquifers. Local aquifer compartmentalisation can result from total or partial juxtaposition against an aquitard.
Reactivation of the regional faults occurred again in the Cenozoic. Most monoclines mapped at surface throughout the basin resulted from this phase of movement. Structural abutment of aquifers against basement blocks and highs, as with faults, may either suppress hydrologic connectivity or force upward connectivity.
2.3.2.2.2 Hydrogeology
Figure 12 defines the hydrostratigraphy of the major hydrogeological systems and outlines which units are acting as either an aquifer or an aquitard (or depending on scale, as both).
Conceptually, the aquifers outlined in Figure 12 form a stacked series of groundwater systems. The configuration of these groundwater systems is dependent on a number of factors including the geological framework, the hydraulic properties of the various geological units and topography. The geological framework configuration and the hydraulic properties of the hydrostratigraphic units will determine what potential interaction occurs between the different groundwater systems. Some general background references on groundwater system concepts and their application include Fetter (2001) and Toth (2009).
There are three major hydrogeological systems present in the Galilee subregion. These are the Cenozoic, Eromanga Basin and Galilee Basin systems. In the Eromanga Basin, the major groundwater systems are the regional watertable aquifer developed in the Winton-Mackunda-Wallumbilla formations, and the deeper confined regional groundwater systems that occur principally in the Hutton Sandstone, Adori Sandstone and Cadna-owie – Hooray aquifer.
In the Galilee Basin, the main groundwater systems occur in the Clematis Group aquifer, the upper Permian coal measures and Joe Joe Group.
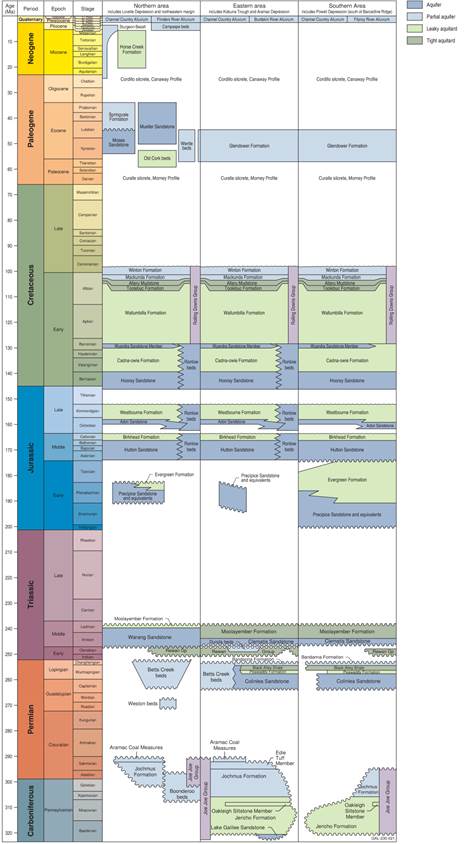
Time periods for hydrostratigraphic sequences are: (i) Cenozoic cover - Paleogene to Quaternary; (ii) Eromanga Basin: Jurassic to Late Cretaceous; (iii) Galilee Basin - late Carboniferous to Middle Triassic.
After Figure 9 in Section 2.1.2 of companion product 2.1-2.2 for the Galilee subregion (Evans et al., 2018).
2.3.2.2.2.1 Cenozoic aquifers
Aquifers in Cenozoic sediments overlie all other (older) hydrostratigraphic units and are commonly associated with present-day surface drainage systems. Depending on the local geology groundwater systems in Cenozoic aquifers may be either connected or disconnected from deeper aquifers. Depth to groundwater in Cenozoic sediments is mostly less than 20 m from surface. Distribution of Cenozoic sediments and watertable mapping for the Cenozoic aquifer in Belyando river basin are respectively outlined in Figure 13 (Section 2.1.2) and Figure 56 (Section 2.1.3) of companion product 2.1-2.2 for the Galilee subregion (Evans et al., 2018).
Groundwater flow for these Cenozoic aquifers is characteristically controlled by local- to regional-scale topographic features, with the flow direction focusing towards major surface drainage features such as rivers and lakes. While the overall groundwater flow direction varies, it moves consistently away from catchment divides. Lake Buchanan and Lake Galilee occur in closed lake basins situated between the Great Dividing Range and the ranges that demarcate the edge of the Eromanga Basin (see also Figure 7 and Figure 18). Conceptually, these lakes may receive groundwater discharge from Cenozoic aquifers that are in the vicinity of the lakes.
Recharge to Cenozoic aquifers can be via rainfall, intermittent flooding of low-lying areas, streams losing water to the shallow watertable, or upwards leakage to shallow aquifers from deeper aquifer systems. Discharge can take the form of baseflow to major drainage or lakes, evapotranspiration, pumping from groundwater bores or leakage to underlying aquifers. Whether evapotranspiration directly from groundwater sources occurs in an area is partially dependent on the type of vegetation present (e.g. river red gums, Eucalyptus camaldulensis var. obtusa) and local hydrogeology. Generally, evapotranspiration could be considered a contributing mechanism if depth to watertable is less than 20 m. Where Cenozoic aquifers extend beyond the Galilee subregion boundary, discharge could take the form of throughflow, moving out of the Galilee subregion.
2.3.2.2.2.2 Regional watertable aquifer — Eromanga Basin
The shallowest groundwater system in the Eromanga Basin is developed in the Winton-Mackunda formations, Alluru Mudstone and Wallumbilla Formation, to the west of the Great Dividing Range. Depending on local geological conditions, this aquifer can in places be overlain by the Cenozoic aquifer system. Details on the potentiometric surface mapping for Winton-Mackunda formations, Alluru Mudstone and Wallumbilla formations are shown in Figure 57 and Figure 58 of Section 2.1.3 of companion product 2.1-2.2 for the Galilee subregion (Evans et al., 2018). The Wallumbilla Formation and Alluru Mudstone comprise much of the Rolling Downs Group aquitard, which is the regional seal for the deeper confined GAB aquifers (Section 2.3.2.2.1.1). Although these units regionally act as an aquitard to underlying aquifers, on a more local scale sandier facies in the Wallumbilla Formation can be used as local water source. Potentiometric surface mapping suggests there is little change in the watertable geometry when transitioning from the Wallumbilla Formation into the Winton-Mackunda aquifer. As a result, the potentiometric surface mapping was combined for all these aquifers. These aquifers are, for the most part, unconfined. There is some potential for these aquifers to be locally confined where the Cenozoic sediments form a thick layer over the top of the aquifer sequence.
Depth to groundwater in this aquifer can be up to 50 m below surface. Depth to groundwater will vary depending on the local geology and location of bores in the landscape. Groundwater mounding can occur under topographically high areas, whereas shallow groundwater may occur nearer to major drainage lines in topographically lower areas (Figure 13). Again, the flow direction is strongly controlled by surface topography, with inferred flow occurring from topographically high areas towards low areas and major drainage lines. Discharge can take the form of baseflow to rivers, evaporation, pumping from bores, or leakage into overlying or underlying aquifers. Where the regional watertable aquifer extends beyond the Galilee subregion boundary, discharge may also occur as throughflow, with groundwater moving westwards out of the Galilee subregion. Groundwater quality varies considerably with average total dissolved solids (TDS) for Winton-Mackunda formations and the Wallumbilla Formation being 3548 mg/L and 2377 mg/L respectively.
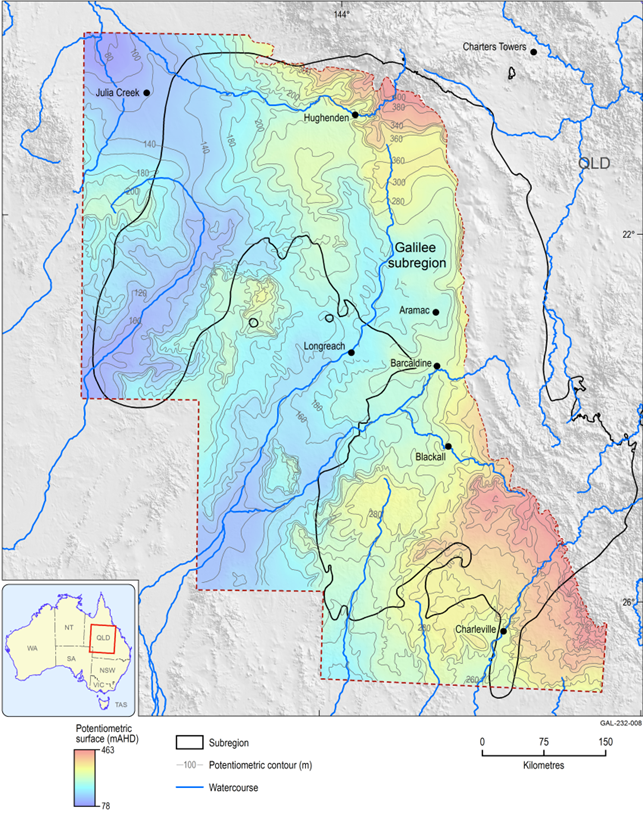
Groundwater has potential to flow from areas with high groundwater levels (red to yellow colours) towards areas with lower groundwater levels (blue colours). The rate of flow is partially dependent on hydraulic characteristics of the geological framework. Groundwater flow in the surficial aquifer tends to focus towards major drainage lines.
Data: Bioregional Assessment Programme (Dataset 7, Dataset 9)
2.3.2.2.2.3 Confined Great Artesian Basin regional groundwater systems — Eromanga Basin
The confined GAB regional groundwater system includes the Hutton and Cadna-owie – Hooray aquifers. Other aquifers in this system are the Adori Sandstone aquifer; the Wyandra Sandstone aquifer, which is a part of the Cadna-owie Formation; and the Ronlow beds, which occur around the north-eastern margin of the Eromanga Basin. The distribution of these hydrostratigraphic units is outlined in Section 2.1.2.2.5, while the potentiometric surface mapping for the Hutton and Cadna-owie – Hooray groundwater systems is detailed in Section 2.1.3.2.2 of companion product 2.1-2.2 for the Galilee subregion (Evans et al., 2018).
Where the recharge areas for the aquifers that comprise the confined GAB regional groundwater systems outcrop, they form a distinct topographic high that follows the eastern margin of the Eromanga Basin (see Figure 7 and Figure 9). West of the outcrop areas, the aquifers become progressively buried by the Rolling Downs Group aquitard. The Rolling Downs Group aquitard includes the Wallumbilla Formation, Toolebuc Formation and Alluru Mudstone and forms a regional seal that confines the underlying GAB regional groundwater systems. The Rolling Downs Group aquitard segregates the confined GAB aquifers from aquifers in the overlying Winton-Mackunda formations. The sealing qualities of the Rolling Downs Group aquitard can vary and are dependent on proximity to faults, including polygonal faulting (Ransley et al., 2015) and the thickness of the aquitard sequence.
Overall, regional groundwater flow in GAB aquifers is in a westerly direction away from topographically elevated areas located along the margins of the Eromanga Basin. The continuity of groundwater flow in the regional aquifer can be disrupted by faults that may offset the aquifer sequence. Figure 14 is an example of potentiometric surface mapping for a confined GAB aquifer, in this case the Hutton Sandstone aquifer, which demonstrates variation in groundwater flow directions that may occur in the Galilee subregion. In the outcrop areas, the GAB aquifers are unconfined, but become confined to the west of areas of outcrop by the Rolling Downs Group aquitard. Artesian conditions will occur where groundwater levels in GAB aquifers exceed the local topographic ground level.
Recharge from rainfall occurs in areas of outcrop along the Eromanga Basin margin (see Section 2.1.3.3.5 in companion product 2.1-2.2 for the Galilee subregion (Evans et al., 2018)) by rainfall or at depth through upward leakage from underlying aquifers that are in direct contact with GAB aquifers; for example, areas where the Clematis Group is in direct contact with the Hutton Sandstone, near the western margin of the Galilee subregion (Figure 11 and Figure 14). Potentially, episodic recharge to these aquifers may also occur during high-flow events or flooding in areas where surface drainage has cut into the recharge areas. This has been found to be an important recharge mechanism where the confined GAB regional aquifers outcrop (and are unconfined by overlying sedimentary rocks) along the western margin of the Eromanga Basin (Miles et al., 2015). Some examples where potential episodic recharge may occur include areas where the Alice River and Flinders River cross-cut recharge areas for the confined GAB regional aquifers.
Discharge can take the form of leakage from confined GAB regional aquifers upwards through the Rolling Downs Group aquitard, but also as natural groundwater throughflow across the subregion boundary. Other significant forms of discharge include springs and bores. Evans et al. (2015) provide an estimate of discharge from bores for various confined GAB regional aquifers.
The Barcaldine Springs complex occurs either side of ranges that comprises GAB aquifer outcrop (Figure 14, inset (a)). While groundwater flow in the confined GAB regional aquifers is predominantly to the west, a local eastward flow component is evident (Figure 14, inset (a)) in the outcrop area. The eastward flow component forms a local scale groundwater system that discharges as a line of springs near the eastern boundary of the GAB aquifer as outcrop springs. A number of springs in the eastern line occur in the vicinity of surface drainage; therefore, there is also some potential for leakage to occur into nearby Cenozoic alluvium. Many of the springs that are to the west of the GAB regional aquifer outcrop are situated on the Rolling Downs Group aquitard outcrop. Drill-hole data and surface geology suggest that, here, the aquitard is relatively thin or missing; therefore, in these areas the confined GAB regional aquifers are discharging at low points in the landscape where the Rolling Downs Group aquitard is compromised (Figure 14).The western spring line also coincides with the Moocha-Nogoa structure (Section 2.1.2 in companion product 2.1-2.2 for the Galilee subregion (Evans et al., 2018)). It is possible that structural disruption along this feature may provide some control on the expression of these springs at surface. Further information on the Barcaldine Springs complex can be found in Fensham et al. (2016).
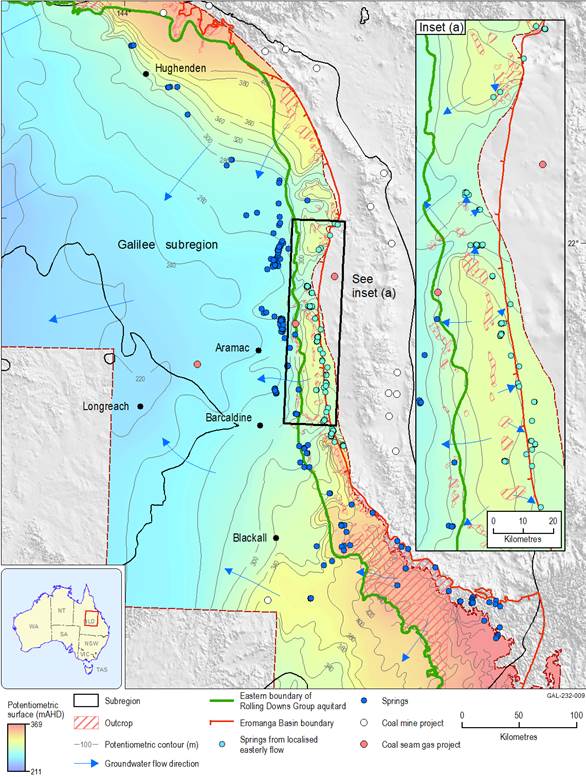
Potentiometric surface mapping for the Hutton Sandstone aquifer is used as an example to demonstrate the variation in lateral groundwater flow direction that may occur in confined Great Artesian Basin regional aquifers. Groundwater has the potential to flow from areas with high groundwater levels (red to yellow colours) towards areas with lower groundwater levels (blue colours). The rate of flow is partially dependent on hydraulic characteristics of the aquifer.
Inset (a) details the flow directions around a groundwater mound that has developed under a topographically elevated area that comprises GAB aquifer outcrop (the recharge beds). Groundwater flow directions are away from the groundwater mound (predominantly to west and east).
Data: Bureau of Meteorology (Dataset 6), Bioregional Assessment Programme (Dataset 7, Dataset 11, Dataset 12), Queensland Department of Natural Resources and Mines (Dataset 10)
2.3.2.2.2.4 Clematis Group groundwater system – Galilee Basin
The Clematis Group aquifer includes the Warang Sandstone and the Clematis Sandstone aquifer. Distribution of the groundwater in the Clematis Group is outlined in Section 2.1.2.2.5, while details on the potentiometric surface mapping and hydrochemistry can be found in Section 2.1.3 of companion product 2.1-2.2 for the Galilee subregion (Evans et al., 2018). The Clematis Group aquifer outcrop occurs just east of the crest of the Great Dividing Range. For the most part, the Clematis Group aquifer is confined by the underlying Rewan Group aquitard and overlying Moolayember Formation aquitard, except in the vicinity of outcrop areas.
The hydrodynamics of the Clematis Group aquifer (Figure 15) is quite different to what occurs in overlying Eromanga Basin aquifers. It is likely there is more compartmentalisation of the aquifer through the development of groundwater divides as well as structural complexity around the Barcaldine Ridge. As much of Clematis Group aquifer is confined, it is possible that some recharge would occur through leakage through underlying and overlying aquifers. Some recharge to the Clematis Group groundwater system may also occur through rainfall in outcrop areas.
An erosional hole in the Clematis Group, associated with the Barcaldine Ridge, forms a dividing barrier in the Clematis Group aquifer groundwater system. South of the Barcaldine Ridge (Figure 15), the groundwater flow potential in the Clematis Group aquifer is generally westward into the basin with some minor eastward flow from the crest of Great Dividing Range towards margins of Clematis Group outcrop.
North of the Barcaldine Ridge, a north-trending groundwater divide (Figure 15) segregates inferred groundwater flow into eastward and westward directed flow components. The part of the Clematis aquifer where the north-trending groundwater divide occurs is deeply buried by overlying sedimentary rocks (mostly Moolayember Formation). If this groundwater divide was projected to surface, it would be located under a topographically elevated area (greater than 300 m AHD) that lies between the crest of the Great Dividing Range and the ranges that occur along the margin of the Eromanga Basin (see Figure 7 and Figure 9 for examples).
On the east side of the groundwater divide, from the Clematis Group aquifer potentiometric mapping (Evans et al., 2018) it is inferred groundwater flow focuses towards the Carmichael River basin and the Doongmabulla Springs complex. This occurs because the Carmichael River and its tributaries have incised into outcrop of the Clematis Group and Moolayember Formation forming topographic low area in the landscape. West of the groundwater divide, flow is inferred to go westwards towards the margin of the Galilee Basin. Here, parts of the Clematis Group are in direct contact with the overlying Hutton Sandstone (Evans et al., 2018), which may provide potential pathways for leakage and interconnection between the two aquifers.
There is some hydrochemical evidence that suggests there is potential for discharge to occur from the western margin of Galilee Basin into overlying aquifers in the Eromanga Basin such as the Hutton Sandstone aquifer (Evans et al., 2018). Discharge rates and volumes though are unknown. Discharge along the eastern margin of the Clematis Group aquifer is likely to contribute baseflow to tributaries of the Carmichael River and is also likely to be the primary source aquifer for the Doongmabulla Springs complex (Evans et al., 2018; Lewis et al., 2018). GHD Pty Ltd (2013) outlined some baseflow modelling estimates for the Carmichael River. It suggests that the baseflow contribution increases dramatically along the reach of the Carmichael River where the Clematis Group subcrops beneath the alluvium and downstream from the Doongmabulla Springs complex. Baseflow contribution then decreases east of where the Clematis Group and Dunda beds subcrop beneath the river. Pumping of bores is another form of discharge from the aquifer.
The Doongmabulla Springs complex consists of 187 spring vents that form around 160 discrete wetland areas (Fensham et al., 2016). The springs and wetland areas occur adjacent to Dyllingo Creek and its tributaries, near the geological contact between the Clematis Group aquifer and overlying Moolayember Formation aquitard. The springs are situated in areas where either the Moolayember Formation aquitard thins, or where the Clematis Group aquifer and Dunda beds outcrop beneath the alluvium in the creek valley. Many of the springs are situated on alluvium overlying either the Moolayember Formation or the Clematis Group. Potentiometric surface mapping (Figure 14) for the Clematis Group aquifer suggests that east of the groundwater divide the regional groundwater flow is towards the Carmichael River. The springs coincide with a low point in potentiometric surface mapping, suggesting that the springs are acting as discharge points for the Clematis Group aquifer and, to a much lesser degree, the Dunda beds.
Further detail on the hydrogeology of the Doongmabulla Springs complex and the dynamics of the hydrology of the spring wetlands is provided in Section 3.4 and Section 3.5 of companion product 3-4 for the Galilee subregion (Lewis et al., 2018). As outlined in Lewis et al. (2018), there is significant local complexity in the hydrogeology of the Doongmabulla Springs complex, with contributions to spring discharge occurring from both confined and unconfined parts of the Clematis Group aquifer, as well as unconfined sections of the Dunda beds aquifer. Lewis et al. (2018) noted that most of the springs occur where the Moolayember Formation substrate fails as an aquitard over confined portions of the Clematis Group aquifer. Whereas, springs in the eastern part of the complex, are associated with outcropping parts of the unconfined Clematis Group aquifer and unconfined aquifers in the Dunda beds.
As outlined in Fensham et al. (2016) and Lewis et al. (2018), it has been hypothesised by other researchers that the upper Permian coal measures may be a significant contributing aquifer to the the Doongmabulla Springs complex. It is less plausible that the upper Permian coal measures is a direct groundwater source for the springs, as potential vertical groundwater flow would be significantly impeded by the overlying Rewan Group aquitard. Data from Shoemaker 1, a CSG exploration well drilled within a few kilometres of Doongmabulla Springs complex, suggest that the Rewan Group aquitard is around 330 m thick and the top of the upper Permian coal measures is 653 m below surface (Comet Ridge Ltd, 2010). The Rewan Group aquitard separates the Clematis Group aquifer from the upper Permian coal measures. Investigations (drill stem testing) undertaken as part of the Shoemaker 1 drilling programme measured the reservoir pressures of some coal seams in the upper Permian coal measures. Groundwater levels calculated from the results of these drill stem tests suggest that potential exists for vertical groundwater movement to occur from the upper Permian coal measures to the Clematis Group. However, the relatively low hydraulic conductivity of the Rewan Group, when compared to the Clematis Group, combined with its significant thickness would act to restrict vertical groundwater flow across the aquitard. This would decrease the potential for the upper Permian coal measures to significantly contribute to discharge at the springs.
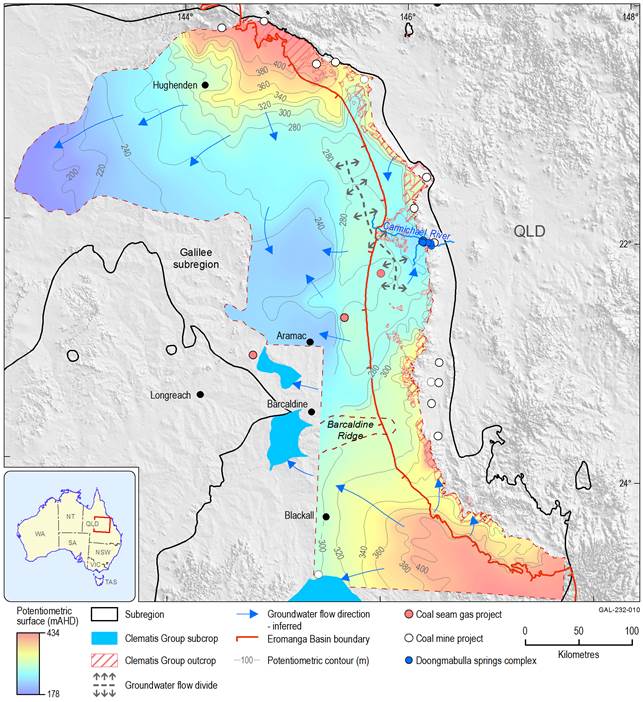
Groundwater has the potential to flow from areas with high groundwater levels (red to yellow colours) towards areas with lower groundwater levels (blue colours). The rate of flow is partially dependent on hydraulic characteristics of the aquifer.
Blue arrows – groundwater flow direction inferred from Clematis Group potentiometric surface.
Data: Bureau of Meteorology (Dataset 6), Bioregional Assessment Programme (Dataset 7, Dataset 9, Dataset 11, Dataset 12, Dataset 13), Queensland Department of Natural Resources and Mines (Dataset 10)
2.3.2.2.2.5 Groundwater systems in the upper Permian coal measures and Joe Joe Group – Galilee Basin
Distribution of upper Permian coal measures and Joe Joe Group is detailed in Section 2.1.2.2.5, whereas details on hydrochemistry and potentiometric surface mapping are available from Section 2.1.3.2.2 of companion product 2.1-2.2 for the Galilee subregion (Evans et al., 2018).
Aquifers in upper Permian coal measures are, for the most part, overlain by Rewan Group aquitard and underlain by Joe Joe Group. The upper Permian coal measures and Joe Joe Group can be in direct contact with the overlying Hutton Sandstone and other GAB aquifers around parts of the western margin of Galilee subregion and the Barcaldine Ridge (Figure 16).
Groundwater systems in the upper Permian coal measures and Joe Joe Group are confined except in outcrop areas along the eastern margin of the Galilee subregion. Section 2.1.3.2.2 in companion product 2.1-2.2 for the Galilee subregion (Evans et al., 2018) shows that there is considerable variation in hydraulic conductivity both spatially and vertically by up to two orders of magnitude (so by a factor up to 100) in the upper Permian coal measures. Thus, the aquifers are highly heterogeneous and anisotropic. Although less is known about hydraulic properties for the Joe Joe Group, for the most part it tends to act as a regional aquitard or, at a more local scale, as a partial aquifer.
Generally, the inferred flow directions in the groundwater systems of the upper Permian coal measures and Joe Joe Group are similar to what has already been described for the Clematis Group aquifer. In Figure 16, potentiometric surface mapping from upper Permian coal measures is used as an example of a groundwater system because potentiometric surface mapping for the Joe Joe Group is of limited extent. However, available potentiometric surface mapping suggests that general trends in groundwater flow direction are similar for aquifers in both the Joe Joe Group and upper Permian coal measures.
As what was noted for the Clematis Group aquifer, it is apparent that a broad groundwater divide exists to the north of the Barcaldine Ridge and that there is potential for groundwater flow to occur eastwards and westwards of the divide towards the margins of the basin. Again, if projected to the surface, the groundwater divide would occur in the topographically elevated area situated between the Great Dividing Range and ranges that demarcate the margin of the Eromanga Basin.
The upper Permian coal measures could receive some recharge through rainfall in areas of outcrop or where confined, as leakage from underlying and overlying hydrostratigraphic units. The Joe Joe Group is the lowermost hydrostratigraphic unit for the Galilee Basin. While a possibility, it is not known if the Joe Joe Group receives any recharge as leakage from hydrostratigraphic units in the underlying Drummond and Adavale basins, which occur beneath the Galilee Basin (for further detail see Section 2.1.2.3.4 in Evans et al. (2018)).
Discharge would be via groundwater extraction or through leakage along the margins of the units into overlying aquifers such as the Hutton Sandstone, where the intervening aquitard is absent. As mentioned previously, there is some hydrochemical evidence (Section 2.1.3.2.1 in Evans et al. (2018)) that suggests that discharge is occurring from Galilee Basin groundwater systems into the overlying Hutton Sandstone aquifer along the western margin of the Galilee Basin, although the rate and volume of discharge are unknown.
Along the eastern margin of the Galilee subregion, inferred groundwater flow focusses towards the topographically low area situated between the Kevin’s Corner and China Stone coal projects, in particular in the vicinity of the Mellaluka Springs complex. Discharge can take the form of springs, or where connection exists, as upwards leakage to overlying Cenozoic aquifers. For instance, the Mellaluka springs complex is situated away from major drainage lines (GHD Pty Ltd, 2013) but is discharging through Cenozoic sediments. Conversely, in some other areas, clay layers in Cenozoic sediments may be thick enough to act as confining layers to impede significant upward leakage into shallow Cenozoic aquifers.
Some unusual features in Galilee Basin groundwater systems and their possible influence on coal seam gas distribution
Regional potentiometric surface mapping completed as part of the BA for the Galilee subregion represents a new contribution to understanding groundwater systems in the Galilee Basin. As described in previous sections, this new mapping has identified some interesting features. These include:
- north-trending groundwater divide situated to the north of the Barcaldine Ridge. This is a feature common to all Galilee Basin groundwater systems for which groundwater mapping has been undertaken as part of the BA for the Galilee subregion
- trends in CSG content and its possible relationship to groundwater systems and geological structure.
There are a number of factors that may influence the location of the groundwater divide and trends in CSG content as outlined in Evans et al. (2018) and this section. These factors include: hydrodynamics of Galilee Basin groundwater systems, surface topography and landscape evolution, variations in hydraulic conductivity and porosity, possible compartmentalisation in Galilee Basin aquifers, geological structures (e.g. major faults, fold hinges), or hydrocarbons pressurising deep parts of the groundwater system.
This groundwater divide in Galilee Basin underlies a broad elevated topographic area at surface, situated between the Great Dividing Range and the Eromanga Basin margin. Other present-day landscape features may be an influential factor on the position of the groundwater divide. For example, the Carmichael River and its tributaries (Figure 15 and Figure 18) have cut farther westward into the Great Dividing Range than many other rivers in its vicinity. Pressures in groundwater systems would have to accommodate the presence of Carmichael River, which would effectively move the groundwater divide westward. The effect of the Carmichael River on Clematis Group aquifer is apparent in Figure 15, with inferred groundwater flow directed towards the Carmichael River from areas located well away from it.
The zone of higher gas contents (Figure 16) is situated between areas where groundwater discharge may occur at the margins of the Galilee Basin. It is also parallel to some large faults that have been mapped at the top of the upper Permian coal measures (Figure 16). One hypothesis that may explain the CSG trend is that groundwater hydrodynamics and geological structure have modified the gas distribution and content in the coal seams. For example, Burra et al. (2014) and Hamilton et al. (2015) discuss examples in the Sydney and Surat basins respectively, where it is postulated that regional groundwater hydrodynamics have influenced gas distribution and gas content in the coal seams.
For the Sydney and Surat basin examples, groundwater flow is conceptualised to occur from elevated outcrop areas found at the sedimentary basin margin towards the central parts of the basins. However, for the Galilee Basin there is no obvious pathway for basin margin recharge to reach CSG-bearing coal seams at depth. The major groundwater divide (Figure 16) segregates coal seams with relatively high biogenic gas contents from any possible recharge that may occur around the eastern margin of the basin.
Section 2.1.2.2.5.4 of companion product 2.1-2.2 for the Galilee subregion (Evans et al., 2018) outlines the gas content distribution for upper Permian coal measures in the Galilee Basin. I’Anson (2013) also outlined gas content distributions and gas saturation levels for coals. Gas content measurements (> 4 m3/t dry ash free (DAF)) and gas saturation levels in the coals define a distinct south-west trending CSG fairway in the vicinity of the Glenaras and Gunn projects (see trend arrow in Figure 16). The trend of this CSG fairway is contrary to the northerly trend of the groundwater divide (Figure 16). From these lines of evidence it can be inferred that pressure from gas-charged coal seams is unlikely to have influenced the development of the regional groundwater divide.
There are occurrences of hydrocarbons in the Joe Joe Group (see Hawkins and Green, 1993). More recently, Comet Ridge Ltd (2016) has defined a tight gas resource in the Lake Galilee Sandstone, a hydrocarbon reservoir situated at the base of the Joe Joe Group. Another hypothesis could be that the groundwater divides may in part be a response to structural accumulation of gas in deeper sections of Galilee Basin and that pressure at deeper levels may be influencing groundwater systems at shallower levels in the Joe Joe Group and upper Permian coal measures. However, reports on available gas isotope data (companion product 2.1-2.2 for the Galilee subregion (Evans et al., 2018); I’Anson, 2013) suggest that gases in the upper Permian coal measures have a predominantly biogenic origin. Evans et al. (2018) demonstrate that the gas content of the coal seams peak between 800 and 1200 m and then decline, even though coal seams can occur down to depths of 2000 m. These lines of evidence suggest that there may be minimal influence through migration of gas from deeper sources, as gas contents in the coals do not increase or stay constant with depth. The CSG appears to have been generated in the coal seams mainly via biogenic processes.
There is potential for hydrocarbons to influence the groundwater pressure regime (e.g. tight gas accumulations in the Lake Galilee Sandstone in the Joe Joe Group, or underlying geological basins such as the Adavale, Drummond and Belyando basins) below the coal measures.
Overall, an improved understanding of structural geology, stratigraphy, lithological variations, aquifer compartmentalisation and distribution of rock properties such as porosity and hydraulic conductivity on a regional scale would assist in better understanding the dynamics of deep groundwater systems in the Galilee Basin. Investigations of landscape history and processes in the Carmichael river basin may also assist with understanding the evolution of groundwater systems in the Galilee Basin.
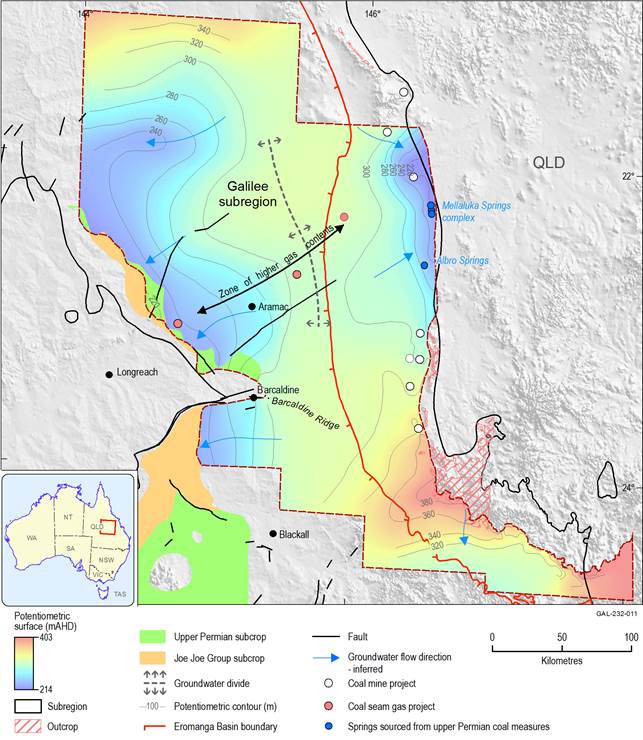
Groundwater has the potential to flow from areas of high groundwater level (red to yellow colours) towards areas with lower groundwater level (blue colours). The rate of flow is partially dependent on hydraulic characteristics of the geological framework of the aquifer.
‘Zone of higher gas contents’ arrow represents broad trend in south-west trend gas content outlined in Figure 26 (Section 2.1.2.2.5.4 of companion product 2.1-2.2 for the Galilee subregion (Evans et al., 2018)).
Data: Geoscience Australia (Dataset 2), Bureau of Meteorology (Dataset 6), Bioregional Assessment Programme (Dataset 7, Dataset 9, Dataset 11, Dataset 13), Queensland Department of Natural Resources and Mines (Dataset 10)
2.3.2.2.3 Surface water – groundwater interactions
Surface water – groundwater interactions in the Galilee subregion are indicated by discharge from shallow groundwater systems to rivers, losing streams (surface water recharging shallow aquifers), spring discharge creating outflow pools, discharge to lakes (e.g. Lake Galilee and Lake Buchanan), shallow groundwater (less than 20 m to watertable) being transpired by deep-rooted plants such as river red gums (Eucalyptus camaldulensis var. obtusa) and groundwater-dependent ecosystems.
Many of the surface water – groundwater interactions and their relationships with groundwater systems have already being outlined in Section 2.3.2.2.2. These include possible source aquifers for some spring groups and the identification of stream reaches that may interact with a particular aquifer (e.g. Carmichael River and Clematis Group aquifer).
Whether a stream is gaining or losing can be dependent on several factors including local geology, depth to groundwater, shape and depth of the river channel, and climate. As discussed in Section 2.3.2.3, most rivers in the Galilee subregion are subject to prolonged no-flow periods during any given year. Figure 17 is a schematic of a mid-section of a Queensland catchment in wet and dry periods and is representative of what may be happening in areas such as the Belyando River and upper reaches of the Thomson River. In the wet period, river flow and flooding may recharge shallow aquifers in alluvial sediments. Groundwater stored in these aquifers may return to river baseflow if sufficiently shallow, or be used as water source for vegetation in riparian zones and on floodplains in dry periods. Eventually, however, once groundwater levels fall below the base of the river channel, baseflow will cease. If groundwater levels are high and a connection exists, shallow groundwater may still discharge to deep pools in a river channel or billabongs on a floodplain. These areas may act as refugia for fauna and flora during dry periods.
Losing streams are defined as a situation where the stream is flowing and the base of the river channel is higher than the local watertable. If a hydraulic connection exists, then there is potential for a stream to lose water to the shallow watertable. Alternatively if there is a barrier (e.g. a thick clay layer), then a stream may be disconnected from the shallow watertable.
Further details on depth to groundwater and its utilisation by ecosystems are outlined in companion product 2.7 for the Galilee subregion (Ickowicz et al., 2018) as well as Section 3.4 in companion product 3-4 (Lewis et al., 2018).
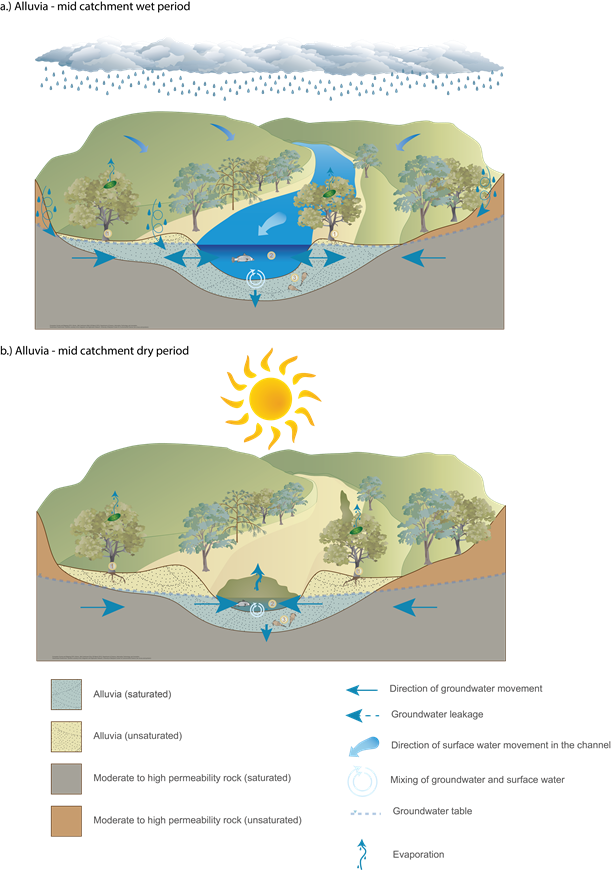
Source: adapted from DSITI (Dataset 14), a.) ‘Alluvia – mid-catchment – wet’ and b.) ‘Alluvia – mid-catchment – dry’, © The State of Queensland (Department of Science, Information Technology and Innovation) 2015
