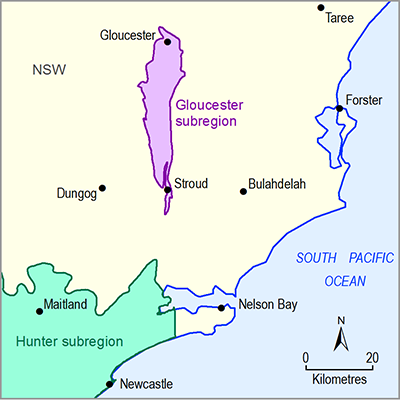
The Gloucester subregion is located just north of the Hunter Valley in NSW, it is approximately 85 km north-northeast of Newcastle and relative to proximal regional centres is 60 km south-west of Taree and 55 km west of Forster. It is located east of the Barrington Tops and west of the Myall Lakes, both of which have high international conservation value (McCauley, 2006, Section 3.3 Land Use). The subregion is defined by the geological Gloucester Basin (Roberts et al., 1991), this is 55 km north–south (at its longest) and 15 km east–west (at its widest). The Newcastle 1:250 000 topographic map (Mapsheet SI5602, Geoscience Australia, 2006) shows that several mountain ranges running approximately north–south bound the subregion on the western edge: they are (from south to north) Linger and Die Ridge and Lawlers Range. It is bounded on the eastern edge (also from south to north) by Brogdens Pinnacles, Copper Mine Ridge, the western foothills of Terreel Ridge and Banks Rocks. Buckleys Range is located in the south-east of the subregion (Mapsheet SI5602, Geoscience Australia, 2006). In the subregion, land–surface elevation ranges from 10 to 515 m (Australian Height Datum (AHD), Figure 5); it exceeds 1000 m (AHD) in the nearby Barrington Tops (located outside the subregion). Within the subregion the small east–west ridge that is the catchment divide between the Avon River catchment and Mammy Johnsons River catchment (which forms the divide between the larger Manning River and the Karuah River basins, see Figure 7) is visible in Figure 5. Figure 6 shows that in the subregion the land surface slopes (calculated using ~90 m resolution grid cell – that is the 3 second shuttle radar topography mission (SRTM; Farr et al., 2007) data) are flat-to-moderate in the undulating centre of the valley and relatively steep in the two bounding mountain ranges. The maximum slope in the subregion is 47 degrees, with some steep slopes being encountered in surrounding mountain areas. There are distinct break-of-slopes where the mountains and valley meet (Figure 6).
Figure 5 Surface elevation and mountain ranges of the Gloucester subregion
The black dotted ellipse (A) contains the east–west aligned ridge that defines the boundary between the Avon River and Mammy Johnsons River catchments (which forms the divide between the larger Manning River and the Karuah River basins ).
Source data: Gallant et al. (2011)
Figure 6 Land surface slopes for the Gloucester subregion
The black dotted ellipse (A) contains the east–west aligned ridge that defines the boundary between the Avon River and Mammy Johnsons River catchments (which forms the divide between the larger Manning River and the Karuah River basins).
Source data: Gallant et al. (2011)
While there are no major wetlands located in the subregion (i.e. those listed in international, national or state databases), many of the rivers have riparian vegetation along the banks. Figure 7 shows that from a surface water perspective the Gloucester subregion straddles the headwaters of parts of two surface water basins being: (i) the Manning River Basin and (ii) the Karuah River Basin. The north-flowing area of the Gloucester subregion drains parts of the Avon River, Gloucester River and Barrington River catchments – all tributaries of the Manning River, which flows past the town of Taree and beyond, to discharge to the Tasman Sea (Figure 7). The south flowing area of the Gloucester subregion drains parts of the Mammy Johnsons River and Karuah River catchments before discharging into Port Stephens (Figure 7).
There is no groundwater connectivity beyond the Gloucester subregion (Parsons Brinckerhoff, 2012a, pp. xxv, 30, 31; SRK, 2010, p. 45). From a groundwater perspective it is a ‘closed system’ with groundwater discharging to lower portions of the landscape and being evaporated through riparian vegetation (Parsons Brinckerhoff, 2012a, pp. 30-31). Over the last 10 years the regional hydrogeology of the Gloucester subregion has only been characterised during commercial assessment of energy resources; there are no other available sources.
Figure 7 Relevant surface water basins, catchments and subcatchments of the Gloucester subregion
(a) shows the entire Manning River and Karuah River basins with their major watercourses and (b) shows an enlargement of just the Gloucester subregion with both the major and minor watercourses.
Source data: Geoscience Australia (2006)
The Gloucester subregion is comprised of two ASRIS (Australian Soil Resource Information System) physiographic classes (Figure 8): (i) Macleay-Barrington Fall (covering 225.5 km2 or 65% of the subregion) and (ii) Liverpool-Barrington Plateaus (covering 121.9 km2 or 35% of the subregion). Their descriptions and those of the physiographic classes in the surrounding areas in the vicinity of the subregion are provided in Table 2.
Figure 8 Physiographic classes of the Gloucester subregion
Source data: Pain et al. (2011)
Table 2 Description of physiographic classes in the Gloucester subregion, and surrounding areas, shown in Figure 8
Source data: Pain et al. (2011)
There are three main soils found in the Gloucester subregion – Kurosol (62.3%), Rudosol (18.0%) and Ferrosol (15.8%) – together covering about 95% of the subregion. Other soils such as Dermosol (3.4%), Tenosol (0.4%) and Sodosol (0.1%) are also present (Figure 9). Their characteristics are briefly introduced below, ordered by descending area. Kurosols are located in mid and lower slope positions. They have a clear, sharp, or abrupt textural boundary between coarser textured A horizons (e.g. sands or loams) and finer textured (i.e. clayey) B horizons (Isbell, 2002). The other distinguishing feature of these soils is the upper 0.2m of the B horizon is strongly acid (pH <5.5). Rudosols are generally associated with upper slopes, ridges and crests. These soils are poorly developed and typically young, so have had little time to develop structure. They may be deep or shallow, and either clayey, or loamy or sandy throughout the profile. Rudosols may also be stony. Ferrosols are located on upland landscape areas, and on crests, ridges or hill flanks. They are typically deeply red in colour reflecting a high concentration of free iron, and lack a strong contrast in texture between the topsoil and subsoil. Their structure is generally very good and if sufficiently deep, they are ideal for agriculture with appropriate erosion management. Dermosols are located in the south of the subregion in lower slope landscape positions, adjacent to the Karuah River, around the town of Stroud, and they are likely to be dominated by clay that is near-uniform to slowly changing in texture in the profile (Isbell, 2002). These are well-structured soils and generally more clayey in the floodplains, where the deepest soils in the subregion are likely to be found. Tenosols in the vicinity of the Gloucester subregion are alluvial soils flanking rivers, so quite recently deposited. This means that they are young, weakly developed soils that have poorly developed (tenic) B horizons (Isbell, 2002). Given the location along rivers, these soils are likely to be dominated by clayey or silty textures, likely with pockets of sand or gravel present, and are probably deep. Parent materials include Permian sandstones and conglomerates of the Leloma Formation (Scheibner and Basden, 1998). Sodosols are generally located in lower hillsides or in perched upper slope locations. They are generally associated with salinity (e.g. at seeps or where drainage is poor), and salts can be of local origin (connate) or windblown. These soils have a strong contrast in textures between the topsoils and subsoil, with very clayey, poorly structured clay subsoil, and can be a challenge to manage for agriculture due to structural issues (caused by excessive sodium ions) and salinity.
Figure 9 Australian Soil Classification (ASC) classes in the Gloucester subregion
Source data: Australian Soil Resource Information System (ASRIS) (2011). National soil data provided by the Australian Collaborative Land Evaluation Program ACLEP, endorsed through the National Committee on Soil and Terrain NCST (www.clw.csiro.au/aclep).
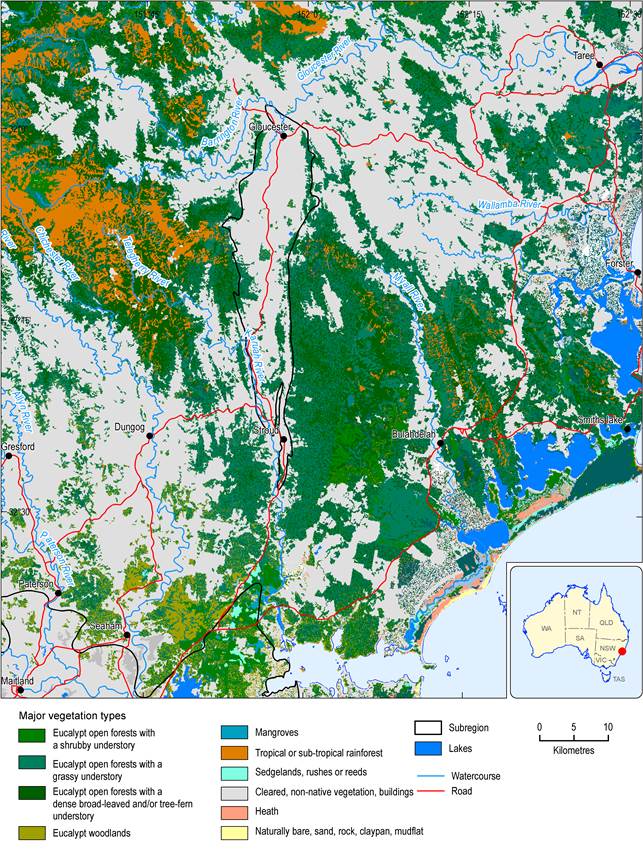
Figure 10 shows that prior to European settlement and its associated land-clearing, the dominant overstorey vegetation in the subregion was: (i) canopy coverage in the range of 30 to 70%, (ii) eucalypt dominated, and (iii) either of the tree or shrub growth-form (Carnahan (1976); Australian Survey and Land Information Group (AUSLIG) (1990)). Cool temperate rainforest dominated by species of Nothofagus were, and are still, present in the vicinity of the subregion (around the Barrington Tops) and low coastal heath was, and is, present in the coastal lowlands north-east of Port Stephens (Figure 10). Since European settlement there has been much vegetation clearing and the current major vegetation types are shown in Figure 11. The majority of the subregion contains non-native vegetation; remnant stands of native forests are found on the slopes of the mountain ranges at the edge of the subregion. Adjacent to the subregion, especially in eastern and western directions, there are tracts of eucalypt forest, sub-tropical rainforest and cool temperate rainforest dominated by Nothofagus species present (Figure 11).
Figure 10 Pre-European vegetation in the Gloucester subregion
Source data: Carnahan (1976); Australian Survey and Land Information Group (AUSLIG) (1990)
Figure 11 Current major vegetation types in the Gloucester subregion
Source data: Australian Government Department of Sustainability Environment Water Population and Communities (2012)
Land cover is best observed from satellite imagery, which provides the opportunity to understand dynamics, calculate long-term averages and to determine the relative contributions from persistent and recurrent vegetation types (Donohue et al., 2009). Figure 12 shows that the total vegetation cover, derived from the MODIS satellite instrument for 2000 to 2012, for most of the subregion varies from 50 to 70%, with the total vegetation cover of the forests at the edge of the subregion (and in the forests surrounding the subregion) exceeding approximately 90%. Most of the vegetation cover is persistent, in that it is ‘green’ for most of the year. Figure 12 shows that only a relatively small proportion of the vegetation has a strong annual signal that defines recurrent (e.g. cropping) vegetation, where land cover varies from bare soil (i.e. zero % vegetation cover) to exceeding approximately 70% vegetation cover over a three to four month period (Figure 12). Within the subregion this evergreen (or persistent) nature of the land cover associated with grazing systems is well known with the average monthly dynamics of the recurrent component illustrating strong ‘summer’ growth from December to May (Figure 13).
Vegetation height can be derived from satellite instruments, specifically lidar (Simard et al., 2011) and, using this data source, Figure 14 shows that the persistent vegetation encountered over much of the Gloucester subregion is short (i.e. ~5 m high in the 1 km resolution grids calculated using data captured in 2005) and that the forests on the edge and those surrounding the subregion have heights exceeding 20 m. While much of the land use in the subregion is grazing (Figure 16), there are isolated remnant mature trees (providing shade for livestock) in paddocks. These trees are causing some cells in pastures to have higher than expected average cell heights.
Figure 12 Vegetation cover in the Gloucester subregion
Long-term average values from 2000 to 2012 derived from the MODIS satellite sensor (Paget and and King, 2008) with a 250 m grid cell resolution are shown. Total cover is temporally decomposed to provide the persistent and recurrent estimates using the method of Donohue et al. (2009).
Figure 13 Monthly recurrent land cover in the Gloucester subregion
Long-term monthly average values from 2000 to 2012 derived from the MODIS satellite sensor (Paget and and King, 2008) with a 250 m grid cell resolution are shown. Total cover is temporally decomposed to provide the persistent and recurrent estimates using the method of Donohue et al. (2009).
Figure 14 Vegetation height of the Gloucester subregion
Source data: Simard et al. (2011)


