The climate of the Clarence-Moreton bioregion falls within the temperate and subtropical climate groupings (ABARES, 2013). The mean annual rainfall varies from 800 to 2716 mm (BOM, 2013a). The highest mean annual rainfall zone is in the east of the bioregion around the State border north-east of Kyogle (Figure 10). The northern part of the bioregion around the Lockyer Valley has the lowest mean annual rainfall (Figure 10). Rainfall is highest in the warmer months (January, February, March) and lowest in the colder months (July, August, September) (Figure 11). Climate statistics are given for four selected stations across the bioregion (Table 5).
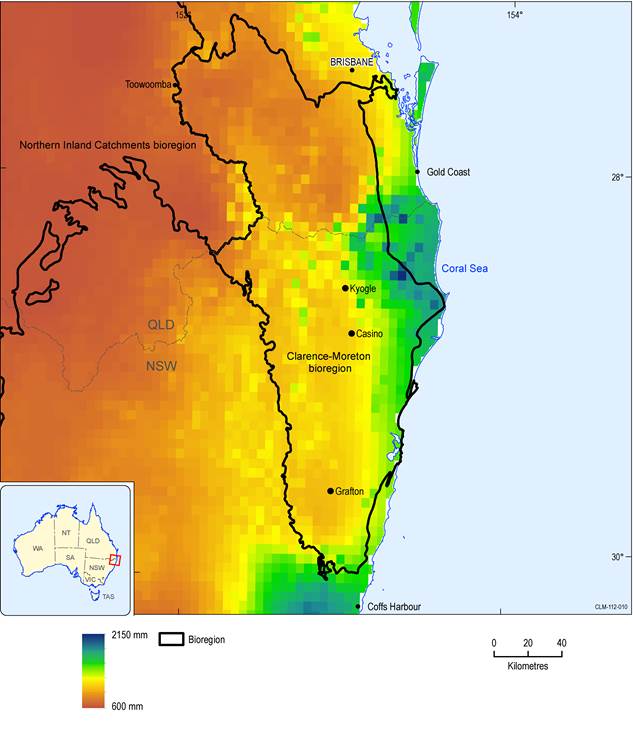
Figure 10 Mean annual rainfall (mm) across the Clarence-Moreton bioregion
Source data: BOM (2013b)
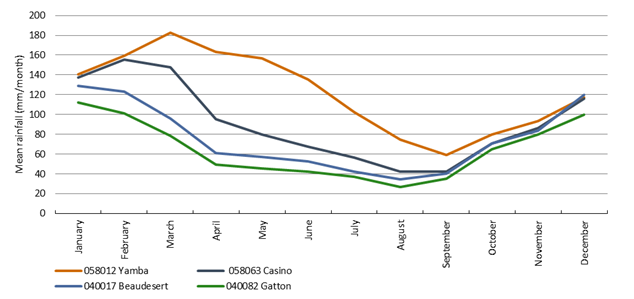
Figure 11 Mean monthly rainfall for four selected stations across the Clarence-Moreton bioregion
Source data: BOM (2013a)
Table 5 Climate statistics for selected climate stations in the Clarence-Moreton bioregion
Source data: BOM (2013a)
Mean annual point potential evapotranspiration varies from 1400 to 2014 mm (BOM, 2013c), with the distribution shown in Figure 12.
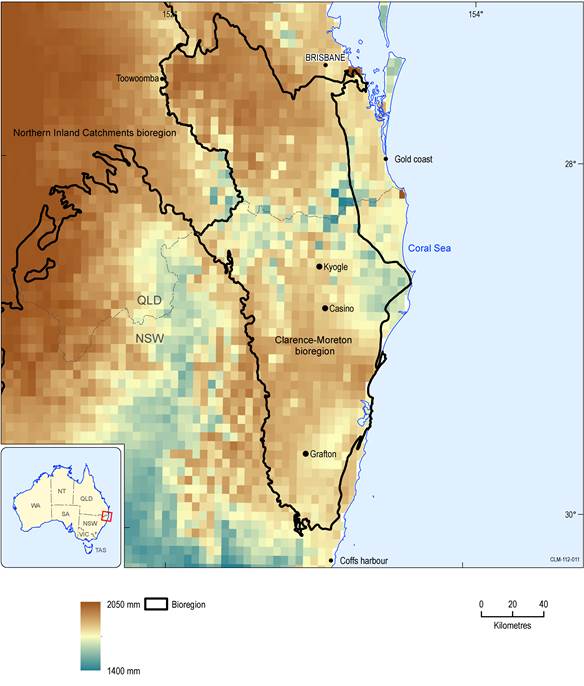
Figure 12 Mean annual point potential evapotranspiration in the Clarence-Moreton bioregion
Source data: BOM (2013c)
Climate statistics are presented here for the entire Clarence-Moreton bioregion. Figure 13a presents the annual rainfall series averaged over the entire bioregion, together with a smoothed moving average. Figure 13b presents the annual divergence from the long-term mean for the entire bioregion. Figure 14 presents the average monthly precipitation, potential evapotranspiration (PET) and aridity index for the Clarence-Moreton bioregion. The black line indicates an aridity index of 1 (i.e. where precipitation is equal to PET). Atmosphere evaporative demand is energy-limited below the black line and water-limited above (assuming no soil moisture storage). Values were calculated over the years 1981 to 2012 (inclusive).
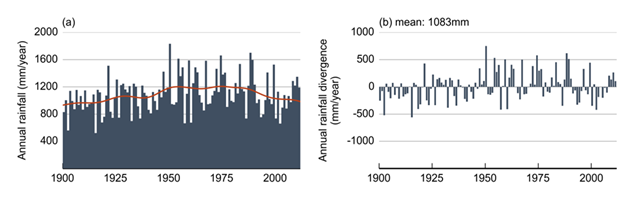
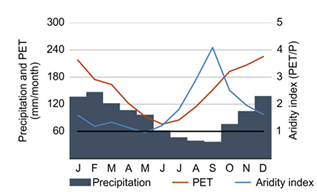
Figure 15 shows monthly average values of precipitation, potential evapotranspiration, temperature, vapour pressure deficit, radiation and wind speed for the Clarence-Moreton bioregion. The trend (line), ±1 standard error (blue shaded area) and trend significance (dashed markers) are shown. Values were calculated over the years 1981 to 2012 (inclusive).
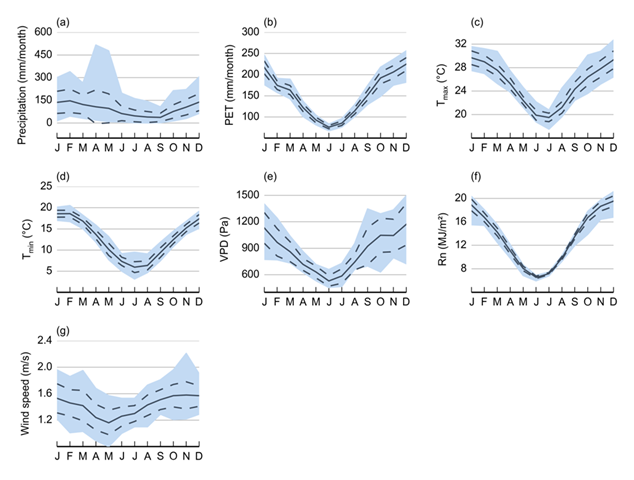
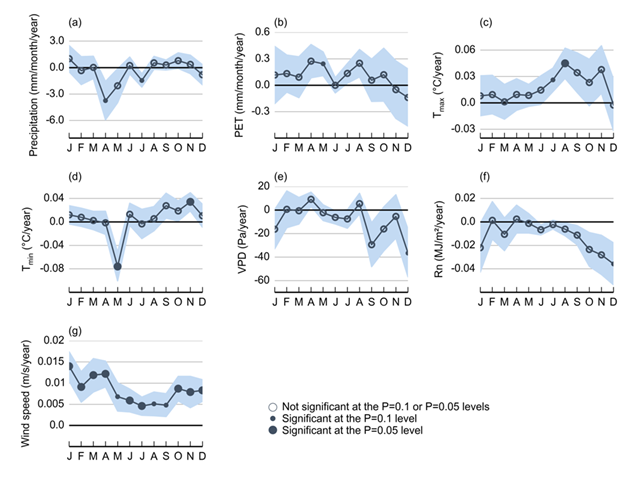
Figure 16 shows the annual trend by month of precipitation, potential evapotranspiration, temperature, vapour pressure deficit, radiation and wind speed for the Clarence-Moreton bioregion. The trend (line), ± 1 standard error (blue shaded area) and trend significance (markers) are shown. Values were calculated over the years 1981 to 2012 (inclusive).