The assessment is built on a large body of evidence and a significant level of detail is provided in the interactive causal network . Bold hyperlinked text in the following sections denotes where causal network node descriptions are available. This brief synthesis cannot capture the full weight of evidence behind the assessment and interested readers are encouraged to interact with the causal network .
All potential impacts due to unconventional gas resource development identified by the assessment can be mitigated through ongoing compliance with existing regulatory and management controls.
The impact assessment for the Cooper GBA region determined: (i) areas of concern (i.e. how much of an endpoint area is of a particular level of concern), (ii) activities, stressors and processes of concern, and (iii) potential impacts on protected fauna, protected flora, aquifers, waterholes, wetlands and other areas.
The causal network for the Cooper GBA region consists of 1 driver node, 8 activity nodes, 19 stressor nodes, 22 process nodes and 25 endpoints ( Table 1 ). Potential impacts due to stressors associated with unconventional gas resource development on water, the environment and selected protected matters are conceptualised in Figure 3 . The percentage of the area in an endpoint that is of ‘potential concern’ is used to indicate the level of concern for each endpoint ( Figure 7 ). However, this does not distinguish between components of an endpoint that may be more or less important. For example, loss of critical food sources or breeding habitat could cause catastrophic loss of an individual endpoint. Endpoint area is the ‘potential’ distribution of protected fauna and flora, or where aquifers, waterholes, wetlands and other areas represented by the endpoint are mapped.
There are 13 environment-related endpoints that were selected to represent important environmental values in the Cooper GBA region. This includes 4 mutually exclusive endpoints that represent the extent and condition of dryland, floodplain, riparian and wetland vegetation in the Cooper GBA region. Another 9 environment-related endpoints represent agricultural grazing, aquifers, nationally and internationally listed wetlands, regionally protected areas and permanent waterholes. In addition, the 12 species prioritised for further assessment are represented by 7 protected fauna and 5 protected flora endpoints.
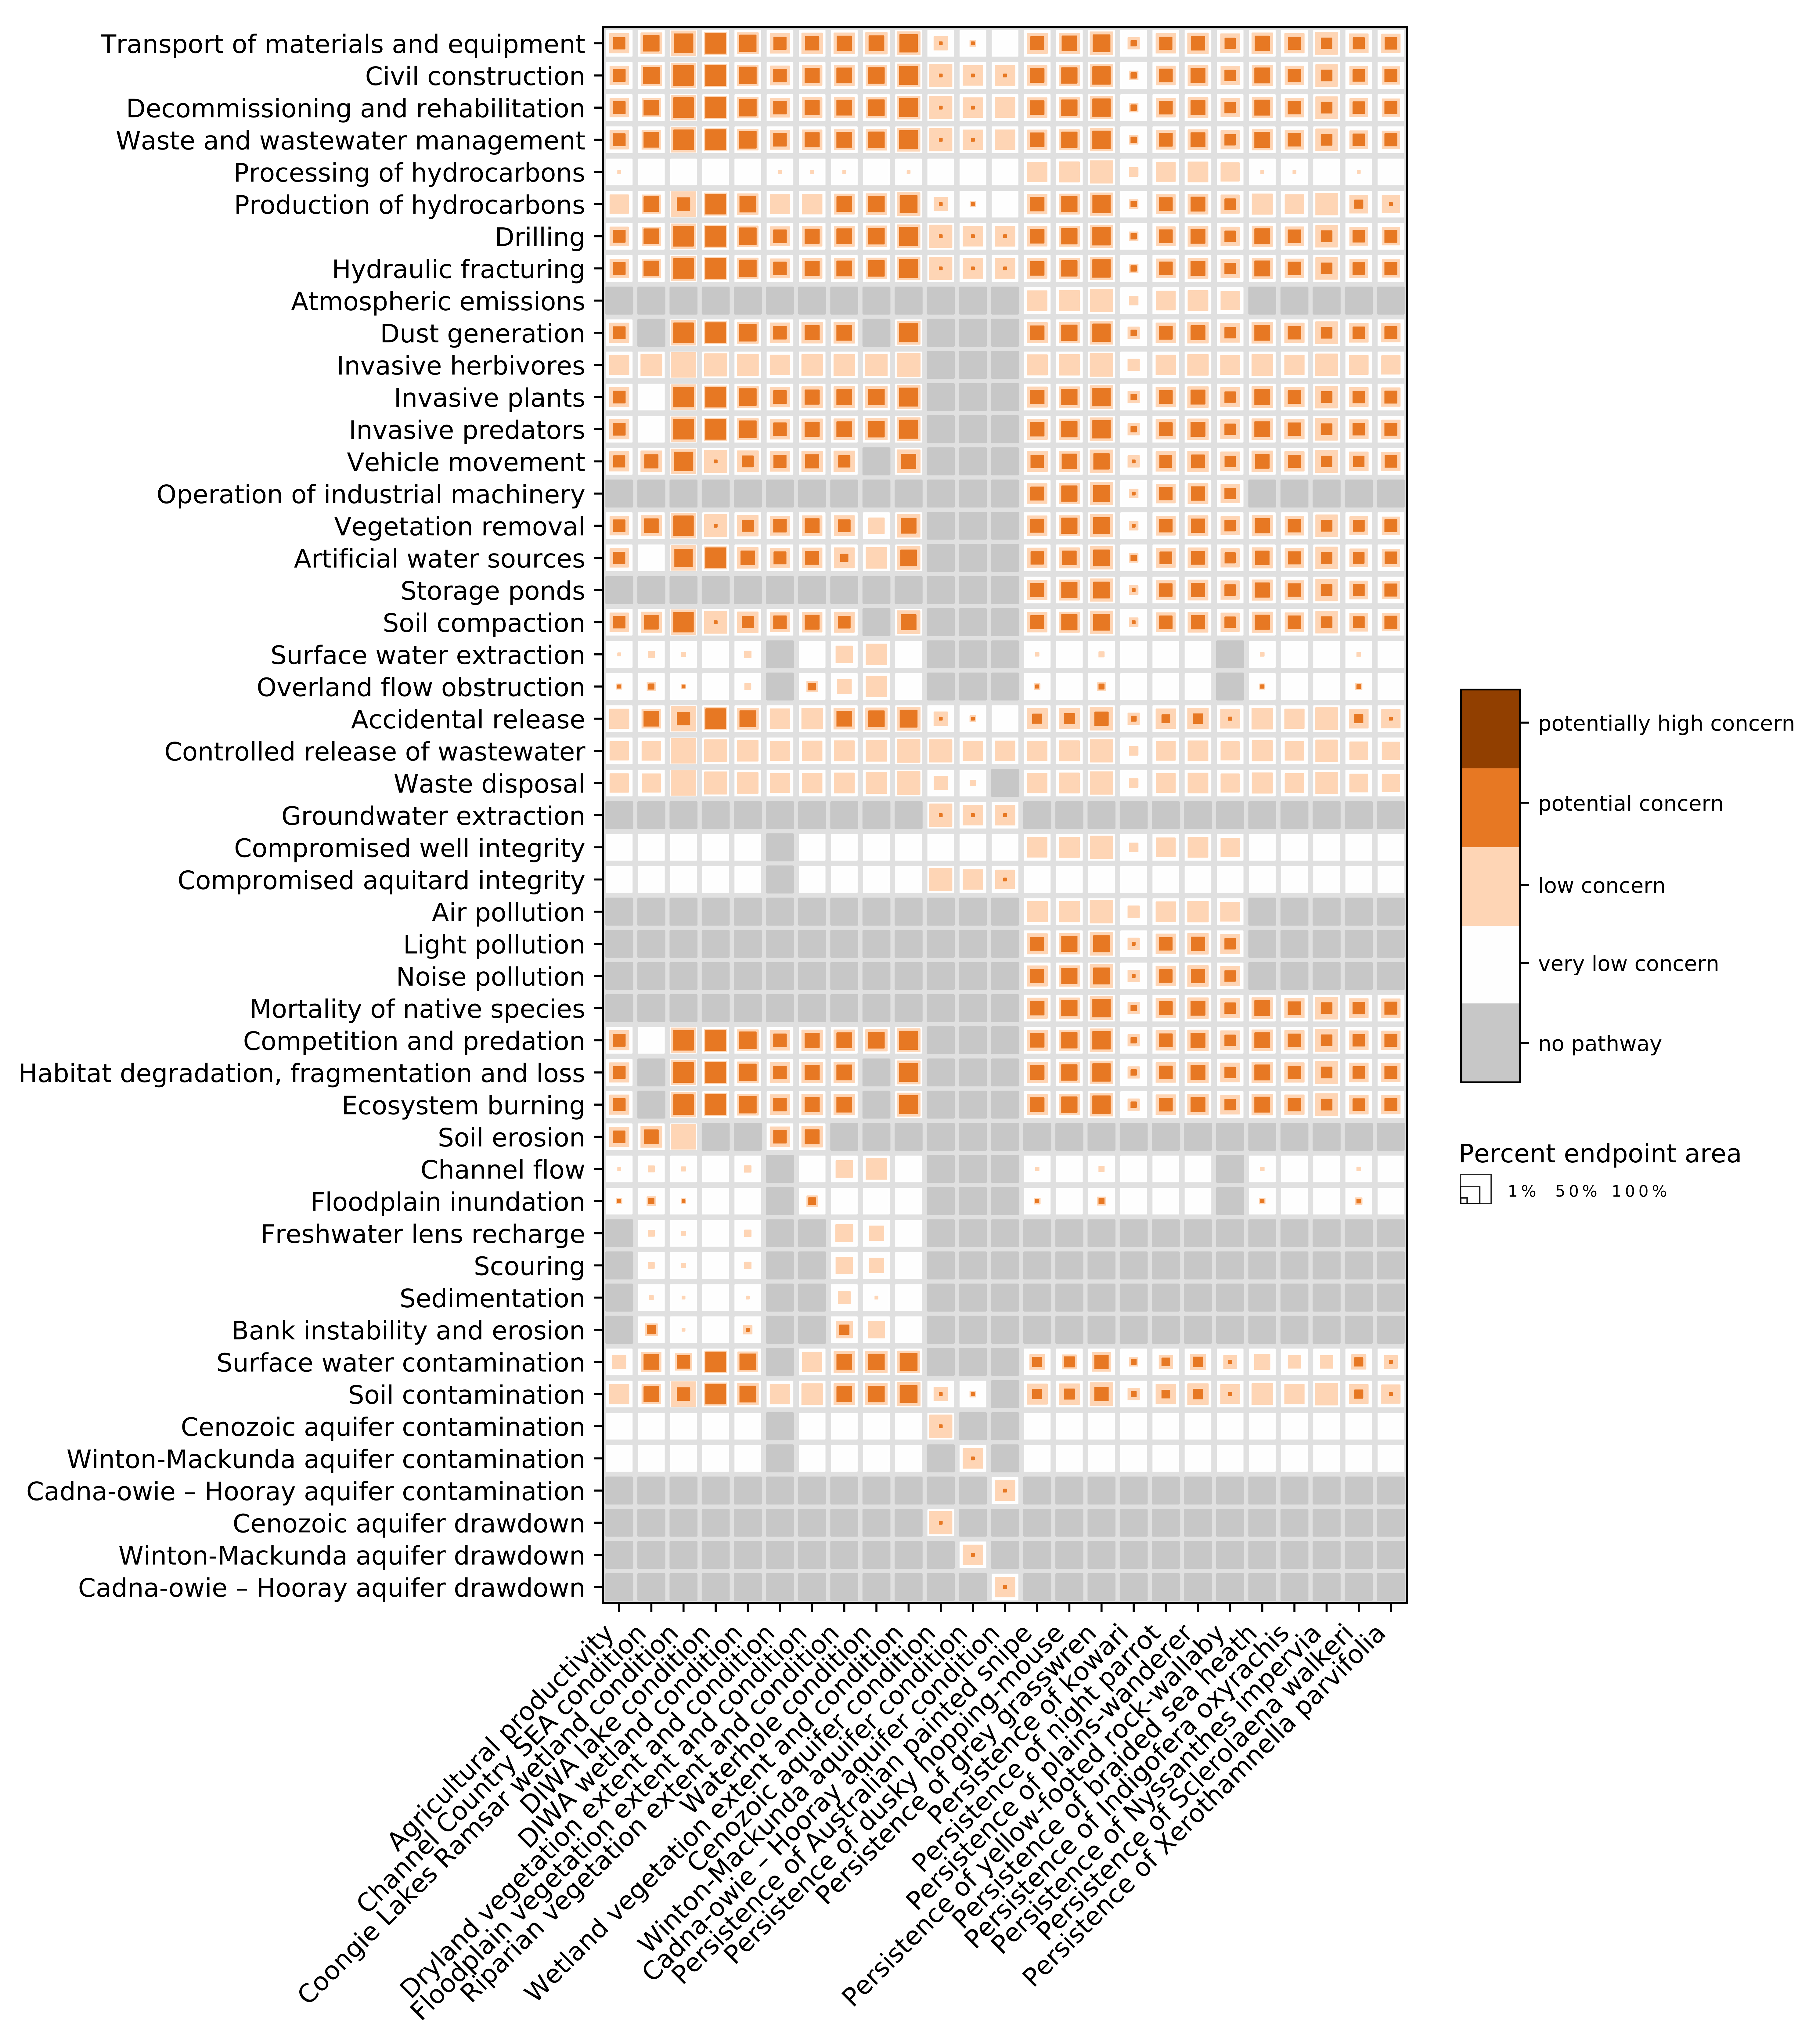
There are no pathways of ‘potentially high concern’ identified in the impact assessment for the Cooper GBA region. All potential impacts identified by the assessment can be mitigated through ongoing compliance with existing regulatory and management controls. Potential impacts on water, the environment, protected fauna and protected flora that are of ‘potential concern’ include 869 pathways associated with 7 of the 8 development activities, 13 of the 19 stressors, 16 of the 22 processes and 23 of the 25 endpoints ( Figure 7 ). Remaining pathways are of ‘low concern’ or ‘very low concern’ ( Table 2 ) in the Cooper GBA region.
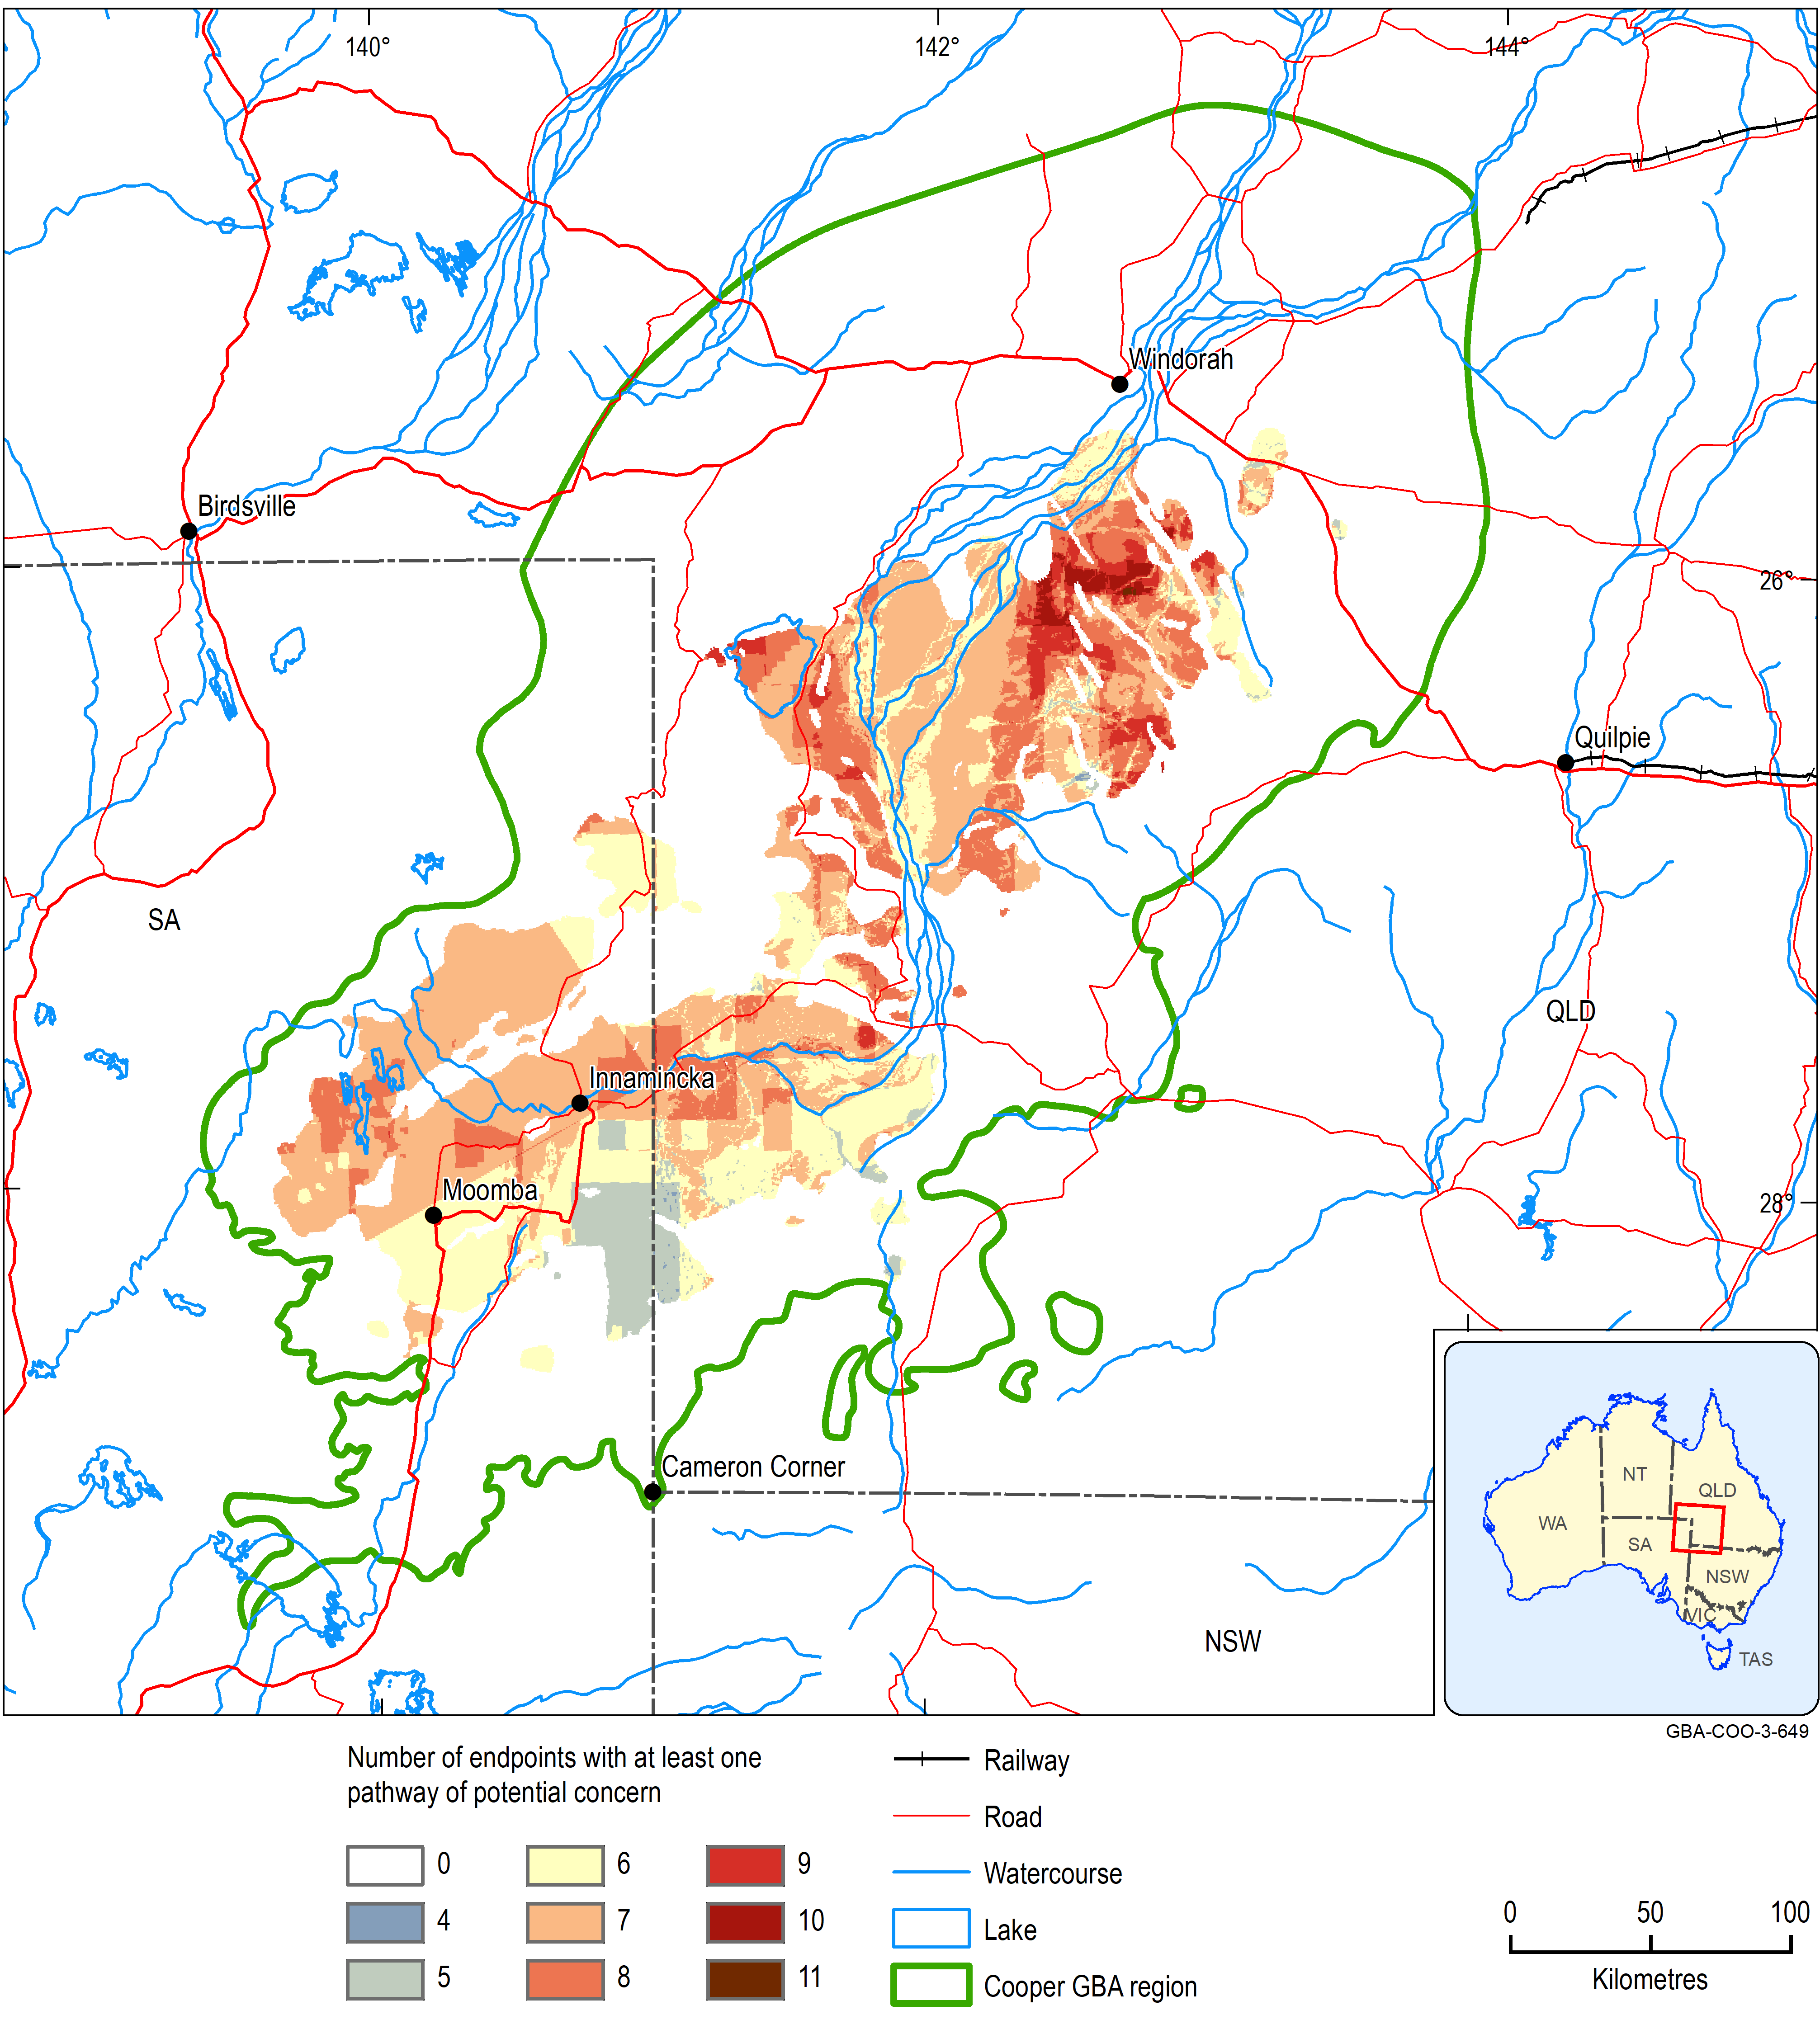
Pathways of ‘potential concern’ are identified in 27% of the Cooper GBA region ( Table 5 ). In Figure 8 , coloured areas show areas where one or more endpoints are of ‘potential concern’. These areas can be prioritised for future assessment, mitigation and management actions. Remaining areas in the Cooper GBA region (no colour) are of ‘low concern’ (33%) or ‘very low concern’ (40%). In these areas, relative prospectivity is generally lower, meaning that unconventional gas resource development activities are unlikely to occur, or pathways from development activities to endpoints are evaluated as not possible, not material or can be avoided.
The following sections discuss potential impacts on water ( Section 4 ) and the environment ( Section 5 ) in more detail. Section 6 discusses potential impacts on protected fauna and flora.
FIGURE 7 Cross-tabulation of the level of concern for activities, stressors, processes and endpoints
View a higher resolution copy of this figure

Data: Geological and Bioregional Assessment Program (2021c)
Element: GBA-COO-3-687
TABLE 5 Percentage of endpoint area (%) by level of concern and total endpoint area (km 2)
|
Endpoint |
Very low concern |
Low concern |
Potential concern |
Potentially high concern |
Endpoint area |
Cooper GBA region |
|---|---|---|---|---|---|---|
|
|
% |
% |
% |
% |
km2 |
% |
|
Agricultural productivity |
45 |
34 |
21 |
0 |
100,771 |
76.6 |
|
Channel Country SEA condition |
35 |
27 |
37 |
0 |
27,834 |
21.2 |
|
Coongie Lakes Ramsar wetland condition |
9 |
33 |
57 |
0 |
12,392 |
9.4 |
|
DIWA lake condition |
27 |
14 |
59 |
0 |
1,135 |
0.9 |
|
DIWA wetland condition |
35 |
24 |
41 |
0 |
3,566 |
2.7 |
|
Dryland vegetation extent and condition |
43 |
34 |
23 |
0 |
88,538 |
67.3 |
|
Floodplain vegetation extent and condition |
37 |
33 |
29 |
0 |
25,283 |
19.2 |
|
Riparian vegetation extent and condition |
37 |
31 |
33 |
0 |
5,626 |
4.3 |
|
Waterhole condition |
32 |
33 |
36 |
0 |
569 |
0.4 |
|
Wetland vegetation extent and condition |
21 |
30 |
49 |
0 |
12,143 |
9.2 |
|
Cenozoic aquifer condition |
25 |
74 |
<0.9 |
0 |
52,531 |
39.9 |
|
Winton-Mackunda aquifer condition |
43 |
57 |
<0.4 |
0 |
131,589 |
100.0 |
|
Cadna-owie – Hooray aquifer condition |
43 |
57 |
<0.1 |
0 |
129,866 |
98.7 |
|
Persistence of dusky hopping-mouse |
38 |
27 |
35 |
0 |
37,180 |
28.3 |
|
Persistence of grey grasswren |
23 |
32 |
45 |
0 |
35,972 |
27.3 |
|
Persistence of kowari |
81 |
15 |
4 |
0 |
9,223 |
7.0 |
|
Persistence of night parrot |
43 |
33 |
24 |
0 |
98,845 |
75.1 |
|
Persistence of plains-wanderer |
37 |
34 |
29 |
0 |
115,311 |
87.6 |
|
Persistence of yellow-footed rock-wallaby |
47 |
37 |
16 |
0 |
18,936 |
14.4 |
|
Persistence of braided sea heath |
36 |
31 |
33 |
0 |
99,448 |
75.6 |
|
Persistence of Indigofera oxyrachis |
45 |
32 |
23 |
0 |
24,886 |
18.9 |
|
Persistence of Nyssanthes impervia |
29 |
54 |
17 |
0 |
7,923 |
6.0 |
|
Persistence of Sclerolaena walkeri |
48 |
33 |
19 |
0 |
80,928 |
61.5 |
|
Persistence of Xerothamnella parvifolia |
50 |
29 |
21 |
0 |
1,542 |
1.2 |
|
Total in Cooper GBA regiona |
40 |
33 |
27 |
0 |
131,589 |
100 |
a Total in Cooper GBA region is the percentage of the endpoint area for each level of concern. It is not the sum total of the percentage of the endpoint area for all endpoints but is the maximum level of concern in each grid cell.
Data: Geological and Bioregional Assessment Program (2021c)
View a higher resolution copy of this figure

Data: Geological and Bioregional Assessment Program (2021c)
Element: GBA-COO-3-649