Causal networks are graphical models that describe the cause-and-effect relationships between development activities and endpoints – the values to be protected – for example, the internationally protected Coongie Lakes wetland. The causal network illustrates the complex and interconnected nature of the natural environment and unconventional gas resource development activities in the Cooper GBA region. It provides a comprehensive and clearly identified set of inferred direct and indirect pathways where development activities may impact on environmental values. Systematic evaluation of likelihood, consequence and mitigation strategies allows qualitative and quantitative information to be integrated, even when the available knowledge base is limited.
In this impact assessment for the Cooper GBA region, a causal network with detailed node descriptions is central to the environmental impact assessment ( Figure 5 ). Existing mitigation and management practices associated with development activities are typically represented by links from activities to stressors along a causal pathway. Whereas subsequent links in the causal network represent the effect an activity has on a process once it occurs. Changes to natural processes are often difficult, if not impossible, to mitigate. This is why it is important that mitigation strategies are implemented early in the chain of events from activities to endpoints.
Nodes represent the different components of the system that make up a causal pathway – drivers, activities, stressors, processes and endpoints ( Table 1 ). Links – represented by arrows – show the hypothesised cause-and-effect relationships between nodes. Grids associated with each link enable representation of spatial variability when evaluating each pathway (Peeters et al., 2021a). Constructing the causal network ( Figure 6) is an exercise that involves multiple disciplines and wide stakeholder engagement. Hazards and causal pathways identified in the baseline synthesis and gap analysis (Holland et al., 2020) were refined and incorporated into the causal network. A comprehensive process of stakeholder engagement in the hazard analysis and technical reviews aimed to accurately capture unconventional gas operation and regulation while addressing user needs. Extensive independent technical reviews of evaluations and documentation in the causal network was also undertaken.
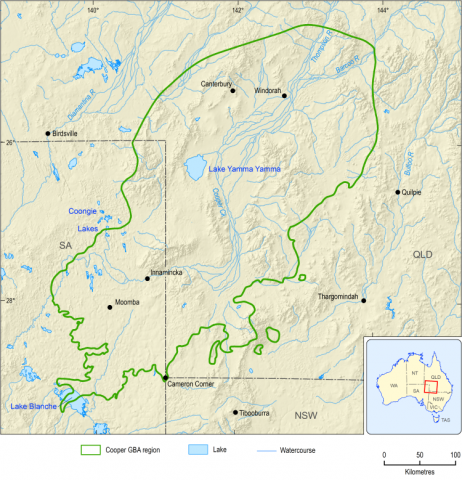
Endpoints are represented in the causal network as ‘assessment endpoints’ defined as an explicit expression of the ecological, economic and/or social values to be protected, and as ‘measurement endpoints’ defined as measurable characteristics or indicators related to the valued characteristic chosen as the assessment endpoint (Suter, 1990; US EPA, 2016) (Section 5.1 in baseline synthesis and gap analysis (Holland et al., 2020)). Endpoints in the causal network for the Cooper GBA region represent aquifers, such as the Cenozoic aquifer; landscapes, such as floodplain vegetation communities; protected areas, such as Coongie Lakes Ramsar wetland; and protected fauna and flora, such as the kowari or braided sea heath listed under state or national legislation ( Table 1 ).
Visually, the causal network illustrates the complex and interconnected nature of natural and regulatory environments in the Cooper GBA region. In general, links from activities to stressors can be mitigated by existing regulatory and industry management frameworks, whereas links from processes to endpoints associated with changes to natural processes are often difficult, if not impossible, to mitigate. Links to subsurface processes and endpoints evaluated as not possible or not material represent the natural barriers that protect overlying aquifers from drawdown or contamination due to gas production in deeper gas reservoirs.
The causal network for the Cooper GBA region ( Figure 6 ) consists of 75 nodes, 268 links and 2,815 pathways. Nodes are organised from left to right, starting with the driver node ‘ resource development ’. Hazards and causal pathways identified in the Stage 2 baseline synthesis and gap analysis (Holland et al., 2020) were refined and incorporated into the causal network.
Links are evaluated according to their likelihood (‘possible’, ‘not possible’), consequence (‘material’, ‘not material’) and management (‘avoidable’, ‘unavoidable but can be mitigated’, ‘unavoidable and cannot be mitigated’) ( Table 2 ). Outcomes of the overall assessment categorise potential impacts on endpoints ( Table 2 ).
Impacts can be minimised or mitigated by existing management controls | Impacts cannot be avoided or mitigated at the scale of the GBA region | ||
The causal networks for the GBA Program are presented in the GBA Explorer . This web-based tool allows users to interact with a graphical presentation of the causal networks with immediate access to the node descriptions, link evaluations and overall assessment summary. Users can visualise the whole entire causal network or simplify it by selecting specific pathways. Spatial data are also presented via interactive maps that include the spatial information used to inform the assessment and spatial link evaluations, and to make spatial impact maps depicting pathways for activity to endpoint, stressor to endpoint and process to endpoint.
Future studies could extend the causal network to other industries, such as pastoralism or tourism. What is not possible with this method is assessing the cumulative impact of multiple stressors on a baseline. This requires firstly a comprehensive and quantitative baseline assessment, which is not yet available, and secondly future projections of the magnitude and likelihood for all stressors (Peeters et al., 2021b).
FIGURE 5 The impact assessment for the Cooper GBA region explained
View a higher resolution copy of this figure
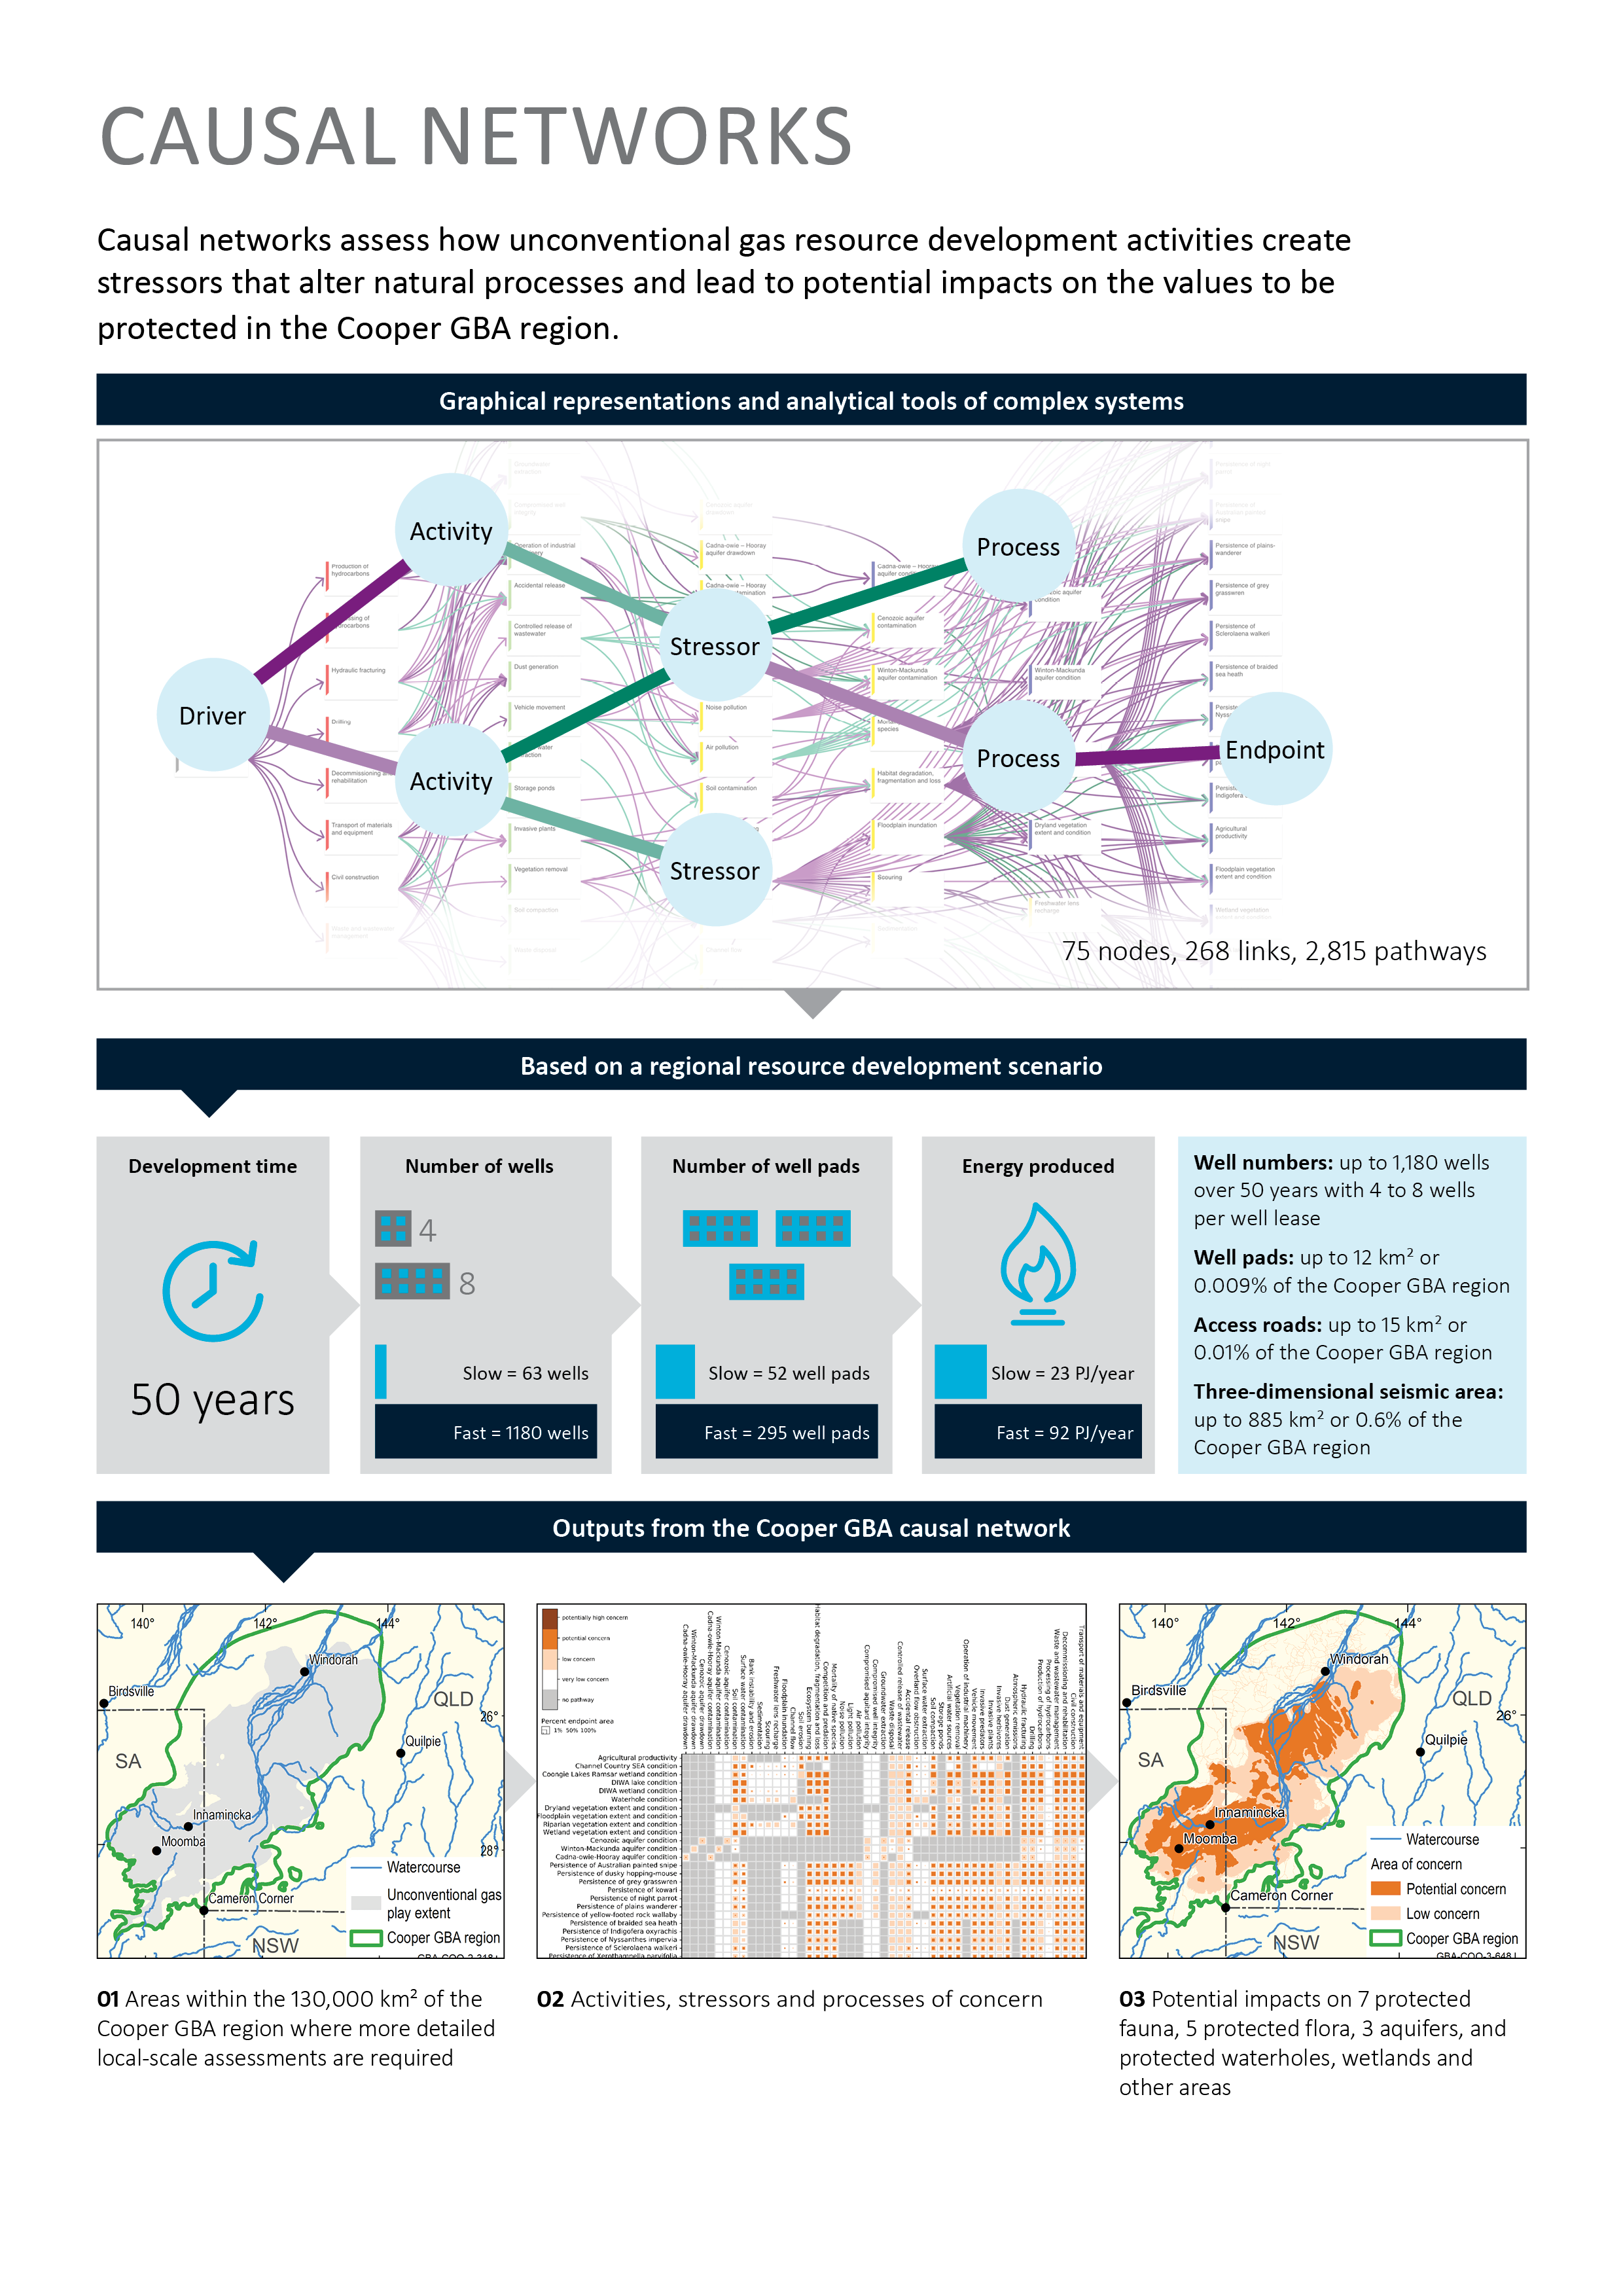
Images in this figure are representative only because many are too detailed for interpretation. They are available from the causal network for the Cooper GBA region in GBA Explorer .
Data: Geological and Bioregional Assessment Program (2021c)
Element: GBA-COO-3-639
FIGURE 6 Causal network for the Cooper GBA region with links colour coded according to their evaluation of likelihood, consequence and mitigation ( Table 2 )
View a higher resolution copy of this figure
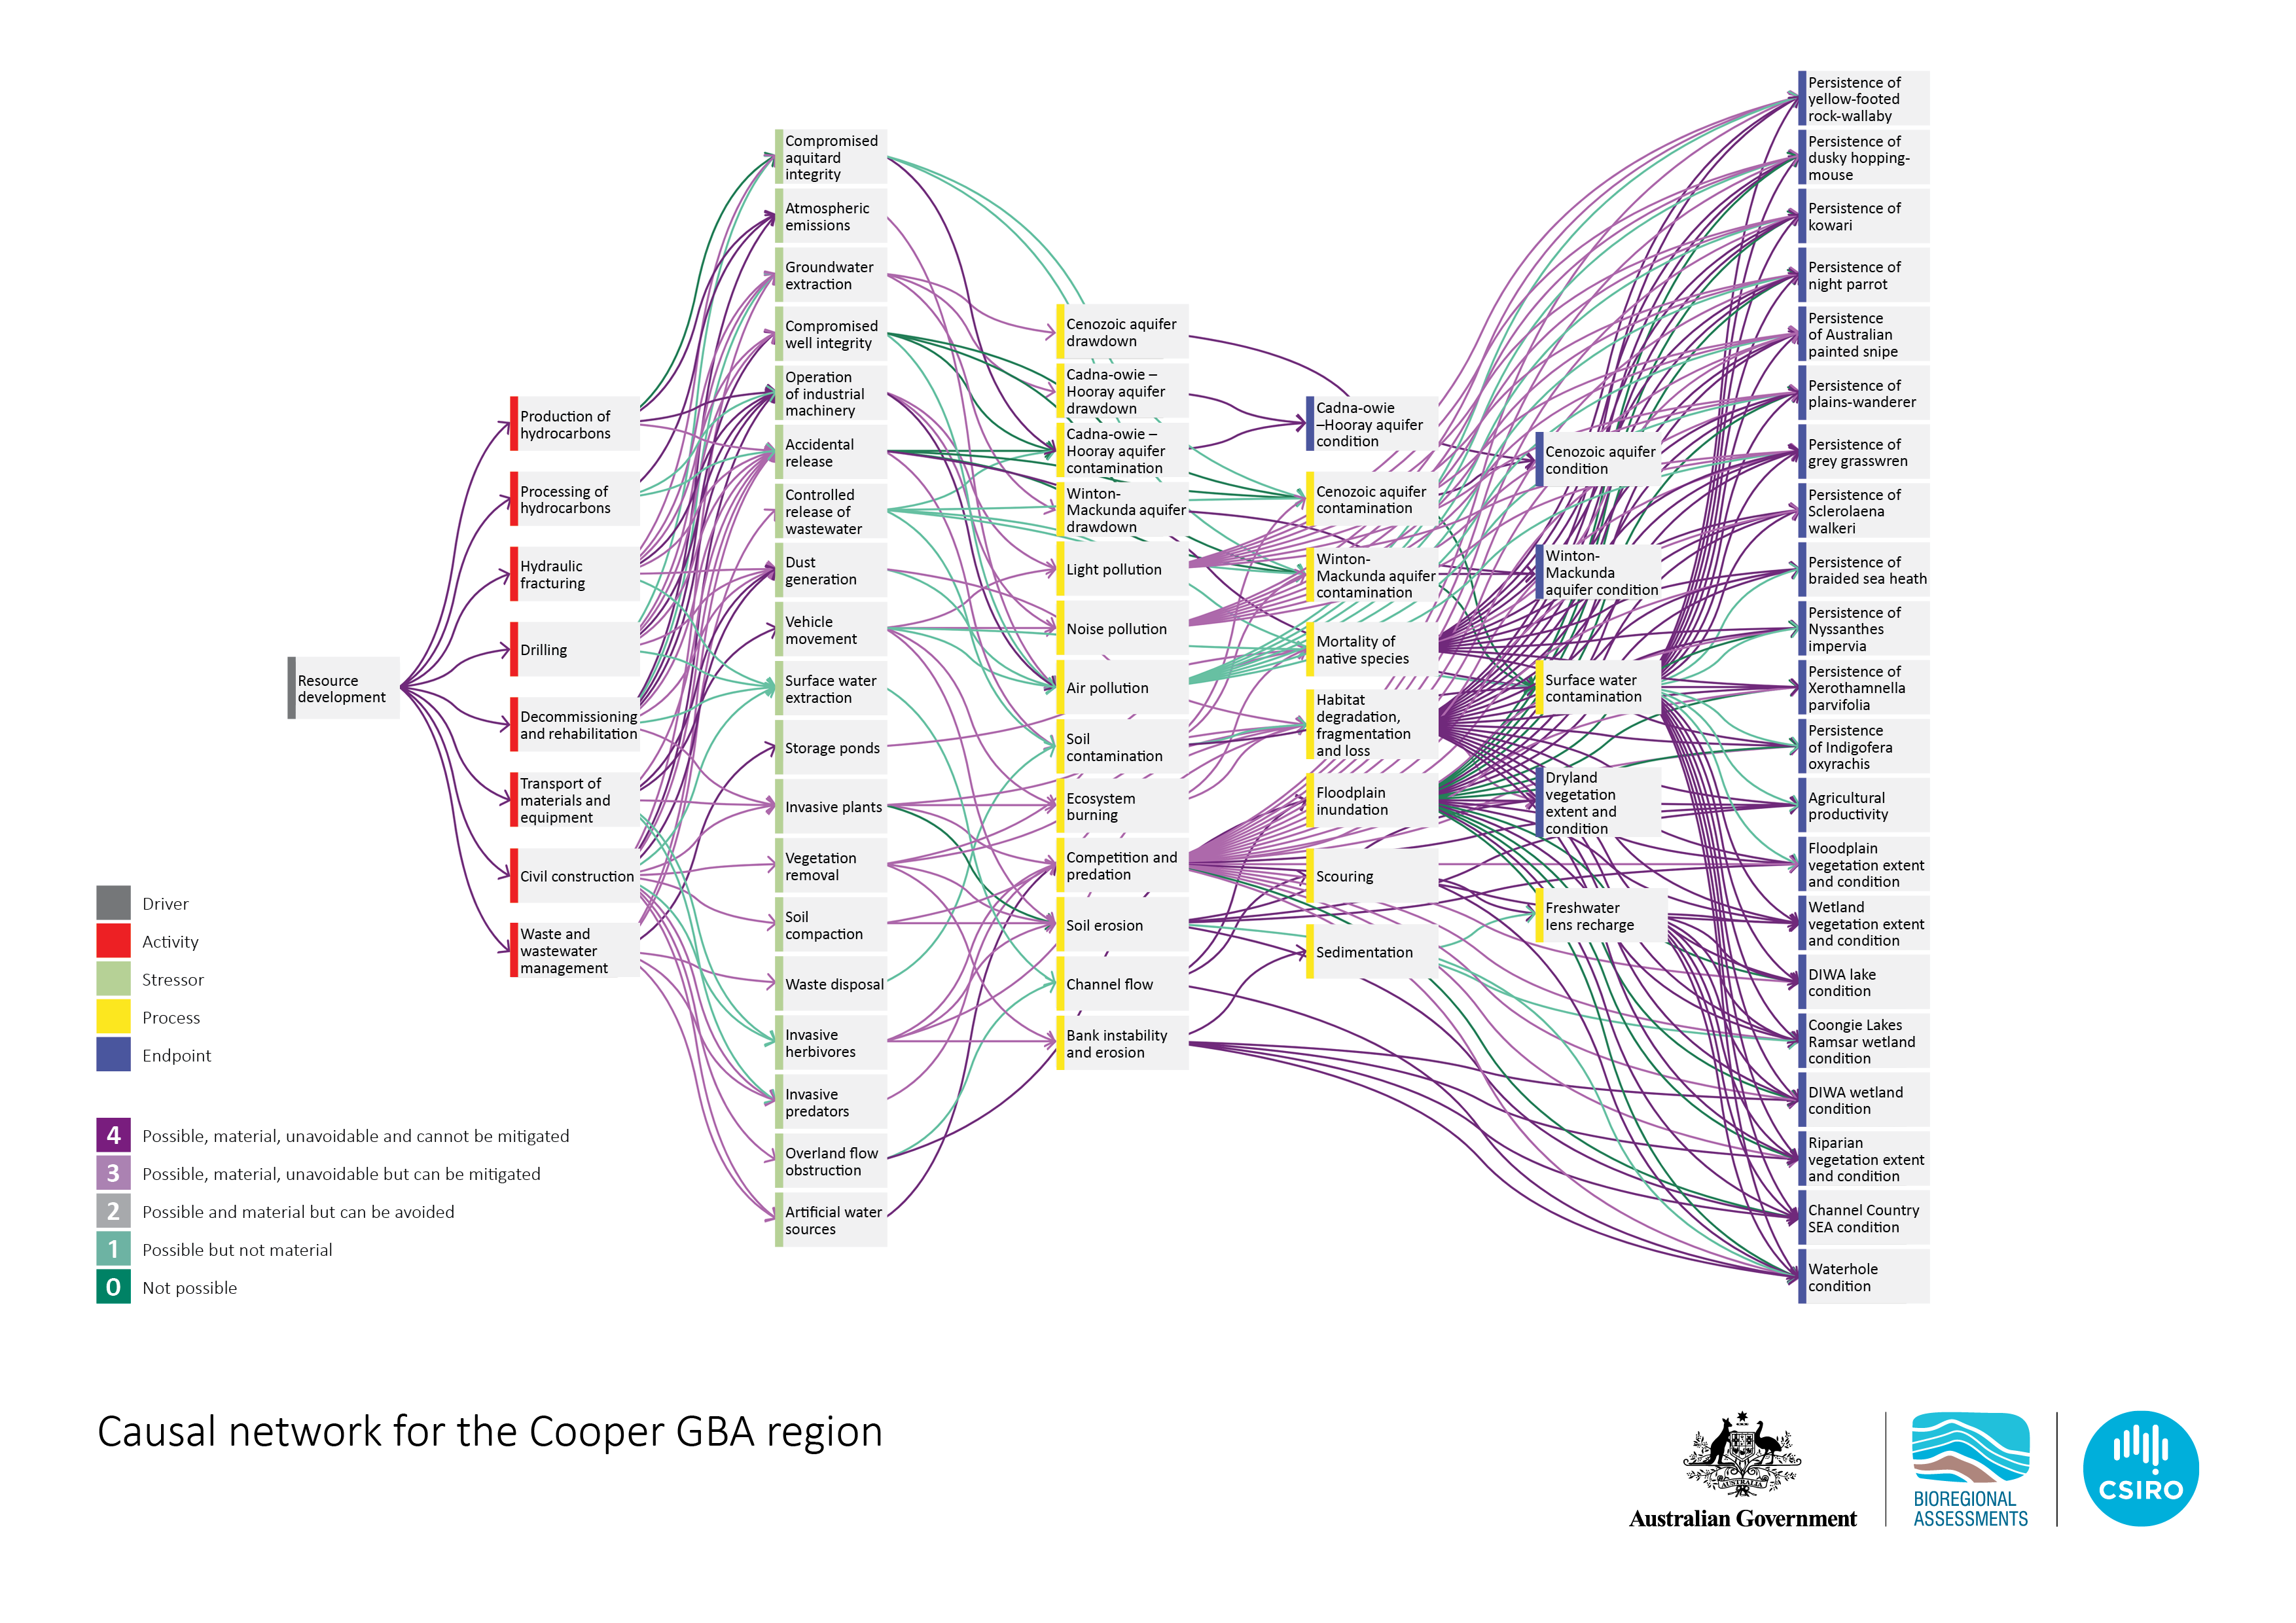
Interact with the GBA Explorer .
Data: Geological and Bioregional Assessment Program (2021c)
Element: GBA-COO-3-640