2.1 Failure Modes and Effects Analysis
Failure Modes and Effects Analysis (FMEA) is a structured process for identifying hazards in complex systems that are typically composed of many components. It was originally developed by the US military in 1949 to determine the effect of equipment and system failures, and was subsequently developed in the mid-1960s to improve safety in the aerospace industry (Ericson, 2005; McDermott et al., 1996). It has since been widely adopted for other industries that operate complex plants, such as the petrochemical industry and the automotive industry, and has also been applied to mining operations in relation to mine equipment safety (Daling and Geffen, 1983; Dhillon, 2009), and the construction and operation of a tailings dams (Correia dos Santos et al., 2012).
FMEA is a ‘bottom-up’ hazard analysis tool. It begins with a thorough description of the overall system, its subsystems and individual components. It then identifies all the possible ways in which each component can fail (the ‘failure modes’) and assesses the severity of the effects of these failures on other components and the overall functioning of the system (Ozog and Bendixen, 1987). It then considers the likelihood of the failure modes and likelihood of their detection given current controls.
In industrial systems, the process is usually formalised in six steps:
- Identify and list all components.
- Identify all failure modes, considering all possible operating modes.
- List the potential effects of each failure mode and score their severity.
- List the potential causes of each failure mode and score their likelihood.
- List the current controls to prevent the failure mode and score the likelihood of detection.
- Calculate the hazard priority number.
The severity, likelihood and detection ratings are usually scored from 1 (lowest rating) to 10 (highest rating). The hazard priority number is the product of the three scores and is the traditional measure used to rank hazards.
A small team of people usually conducts an FMEA, with a coordinating team leader. Each member of the team must be familiar with one or more aspects of the system in question. For example, an industrial FMEA team might consist of a team leader, design engineers, process engineers, plant operatives and their supervisors.
The main advantages of FMEA are that it is systematic, thorough and transparent, and does not require specialised training (but it does require a detailed knowledge of the system under examination). The main disadvantages of FMEA are that it can be time consuming to complete, and does not normally consider the effects of multiple failure modes occurring simultaneously within the system. Nonetheless, it has proven to be an effective hazard analysis tool when implemented correctly (Ostrom and Wilhelmsen, 2012).
2.2 Impact Modes and Effects Analysis
In a traditional FMEA, the failure of an industrial system’s components is defined as a deviation from the function for which it has been designed, or a deviation from its intended operation. In the application of FMEA to BAs, however, the focus is not only on deviations from intended design but also in water-related hazards associated with the intended CSG and coal mining development. In this context hazards can arise as part of the normal operation of the coal mine or CSG operation. The use of the term ‘failure’ is therefore inappropriate and potentially misleading for BAs, so the analysis has been renamed Impact Modes and Effects Analysis (IMEA) to reflect the reporting of impacts, rather than failures. In this IMEA the ‘components’ of the system under study are the whole-of-life-cycle-stage activities, which are planned events associated with a CSG operation or coal mine. Therefore, references to ‘component failures modes’ (in FMEA) are replaced with ‘activity impact modes’, where an impact mode is the manner in which a hazardous chain of events (initiated by an impact cause) could result in an effect (change in the quality and/or quantity of surface water or groundwater). There might be multiple impact modes for each activity or chain of events.
The IMEA reported in this submethodology was specifically designed to meet the risk identification requirements of the BA methodology. The IMEA begins by identifying all activities and processes that occur throughout the life-cycle stages of CSG operations and coal mines. The analysis then considers how each of these activities and processes may potentially impact on water-dependent assets. Each of the impact modes are then scored for severity, likelihood and time to detection (see Figure 7) under a set of control measures that might reasonably be assumed to be in place as part of standard Australian industry operating procedures.
The analysis occurs via workshops; for example, for the Gloucester subregion, the IMEA was completed over three face-to-face workshops. The first workshop focused on identifying all activities associated with the life-cycle stages (from exploration and appraisal through to decommissioning) of CSG operations and coal mines. The remaining two workshops focused on identifying the ways in which this coal resource development potentially impacts on water-dependent assets.
This process was completed in a systematic activity-by-activity fashion, during which each impact mode was scored in terms of:
- severity of effect, where severity is defined as the magnitude of the impact resulting from a hazard
- likelihood of effect, where likelihood is defined as the probability of a hazard occurring
- time to detection (discovery of a hazard) given current controls (the methods or actions currently planned, or in place, to detect hazards when they occur or to reduce the likelihood and/or consequences of these hazards should they occur).
IMEA is an expert-driven approach to hazard identification, mitigation and prioritisation. Its value relies on having the appropriate knowledge and expertise available when identifying and scoring impact modes. For this reason, and due to the focus on groundwater and surface water effects, the workshop for the Gloucester subregion included participants with expertise in geology, hydrology, and mine operation and performance. Workshops for other bioregions typically also require expertise in these areas.
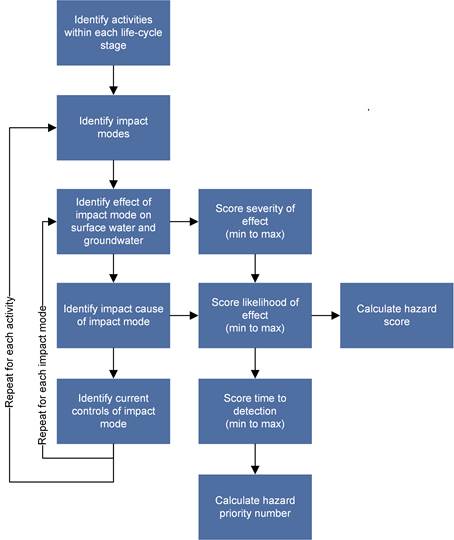
Figure 7 Flow chart showing the steps in an Impact Modes and Effects Analysis (IMEA)
IMEA is a structured hazard analysis methodology that identifies all the activities of a system and the ways in which these activities might have an impact on groundwater and surface water. It then identifies the effects and causes of each impact, and scores the severity and the likelihood of this effect on an interval (min to max). Finally, it identifies current controls that are in place and scores the likelihood of detecting an impact under these controls. This process is repeated for all of an activity’s impact modes and for all the activities of the system under study. At each iteration the sum of the three scores (on a logarithmic scale) is used to rank hazards via the hazard priority number (or two scores in the case of hazard score).
It is important to emphasise that the focus of the IMEA is on hazard identification and relative ranking, not absolute risk estimation. The likelihood and severity scores elicited should not be used as an absolute measure of risk. Expert judgments about the likelihood of uncertain events are known to be prone to a number of biases and errors that occur because humans tend to rely on simple rules of thumb (‘heuristics’) to solve complex problems quickly (Kahneman and Tversky, 1982; Tversky and Kahneman, 1974; Kynn, 2008).
Good risk elicitation exercises employ a series of techniques that are designed to try and avoid the biases and systematic errors that these heuristics induce. These techniques were deliberately not employed when the IMEA scores were elicited because they are time consuming, and the objective of the IMEA scores is to provide a relative measure of each hazard’s importance (i.e. a hazard score where the rank is important, not its absolute value).
2.3 Impact Modes and Effects Analysis structure
2.3.1 Components, life-cycle stages and activities
IMEA attempts to identify all the ways in which all the parts of a complex system may potentially impact on water-dependent assets. Here the ‘parts’ of the system are the activities associated with the major components of a CSG operation or coal mine:
- For CSG operations, the activities were subdivided into those associated with (i) wells, (ii) processing facilities, (iii) pipelines, and (iv) roads and infrastructure.
- For open-cut coal mines, the activities were subdivided into those associated with (i) open pit, (ii) surface facilities, and (iii) infrastructure.
- For underground coal mines, the activities were subdivided into those associated with (i) underground mine layout, (ii) surface facilities, and (iii) infrastructure.
Prior to identifying these activities, each subsystem was further expanded into life-cycle stages, phases in the sequence of activities in a coal mine or CSG operation:
- For CSG operations, these comprised: (i) exploration and appraisal, (ii) construction, (iii) production, (iv) decommissioning, and (v) work-over.
- For open-cut coal mines, these comprised: (i) exploration and appraisal, (ii) development, (iii) production, (iv) closure, and (v) rehabilitation.
- For underground coal mines, these comprised: (i) exploration and appraisal, (ii) development, (iii) production, and (iv) rehabilitation.
It is important to allocate activities to their appropriate life-cycle stage because the scale and duration of similar activities can be quite different across the different life-cycle stages, and this is often reflected in the scores for severity and/or likelihood of the impact modes associated with these activities.
2.3.2 Impact causes, impact modes, effects and stressors
The IMEA identifies all the possible ways in which the activities (as described in Section 2.3.1) may have an impact on groundwater or surface water. The resulting list of hazards occur as a result of various mechanisms (i.e. they have numerous impact causes), and lead to various types of changes in groundwater and surface water (i.e. they have numerous impact modes). These changes in groundwater or surface water are described in terms of effects (i.e. change in the quantity and/or quality of surface water or groundwater). These effects may also be associated with stressors (chemical or biological agent, environmental condition or external stimulus that might contribute to an impact mode). In the case of water quantity, however, the stressor may simply be the change described by the effect (e.g. change in surface water flow). Examples of impact causes, effects and stressors for water quality and quantity are:
- Anthropogenic activities that are deliberate and expected to occur with CSG operations or open-cut coal mines, such as clearing the vegetation along a pipeline corridor (the impact cause), may lead to erosion following heavy rains that increases the concentration of total suspended solids (TSS, the stressor) in surface waters leading to a decrease in water quality (the effect).
- Accidental events due to human error, failures in infrastructure or poor implementation of the operating procedures associated with an activity, such as pipeline containment loss due to accidental rupture or spillage of petrol around refuelling facilities (the impact causes), may lead to organic pollutants (the stressors) reducing the quality of groundwater or surface water (the effects).
- Abnormal natural events, such as heavy rainfall or floods, may compound the impacts of deliberate events or lead to accidental events such as the collapse of a containment pond wall (the impact cause) that leads to a temporary increase in the quantity of surface water flow (the stressor and effect) which may or may not be polluted with anthropogenic contaminants (additional stressors).
The participants in the IMEA workshops are invited to step through a pre-defined list of activities associated with the components of each life-cycle stage and postulate plausible impact modes on an activity-by-activity basis, along with the potential effects of these impact modes on groundwater and/or surface water assets, and any additional stressors.
2.3.3 Scoring severity, likelihood and detection
Traditionally FMEA elicits from experts a single score for the severity, likelihood and probability of, or equivalently time to, detection given current controls. The potential effects (hazards) are then ranked (highest to lowest) according to the product of these scores, known as the hazard priority number (Equation 2).
In our experience, however, the elicitation of scores proceeds far more efficiently if experts are allowed to provide an interval for each score, where the range between the lower and upper bound of this interval represents their uncertainty (Burgman, 2005; Garthwaite et al., 2005). Allowing for a range via the interval also provides a quick and efficient way to envelop and thereby reconcile the opinions of multiple experts in a single elicitation. This avoids forcing the experts to agree on a single most appropriate value, which sometimes they are reluctant to do.
The traditional approach to FMEA scoring is also amended in IMEA by adopting the logarithmic scale recommended by Lin et al. (2013). In this approach scores are provided on a base-ten logarithmic scale. This has two notable advantages over other traditional scoring methods. First, the magnitude of change is a constant multiple (× 10) from one score to the next, thereby assisting with the elicitation and interpretation of the scores. Second, the logarithmic scale creates the opportunity to compare the experts’ scores for the likelihood and detection of events with actual known outcomes, and thereby provide a means to calibrate their scores against actual outcomes.
2.3.3.1 Severity
The IMEA severity score is used to measure the severity of the potential environmental effects of a hazardous activity. Table 3 shows the definitions and corresponding score adapted from Lin et al. (2013) and Adani Mining Pty Ltd (2013). The IMEA elicits an interval (upper and lower score) for each hazard that all participants were able to agree upon. Here a one-unit increase, for example from ‘tiny’ to ‘minimal’, corresponds (roughly) to a ten-fold increase in environmental impact. While the definitions and scores presented in Table 3 relate to the severity of the environmental impact, other types of impact (e.g. economic) may be calibrated to these severity categories as per Jarrett and Westcott (2010).
It is theoretically possible to calibrate the severity scores against actual environmental outcomes. In practice, however, this would be a much more difficult task due to the ambiguity associated with terms used to define the severity scores, despite the guidance provided by the definitions in Table 3. The magnitude of direct impacts associated with CSG and mining operations are quantified in a much more formal, carefully structured elicitation procedure at a later stage in the BA. Again, the role of the impact scores at this stage is to develop an overall hazard ranking, not an absolute measure of risk.
2.3.3.2 Likelihood
The likelihood of a hazard occurring is scored in a similar fashion, so that a one-unit change in score indicates a ten-fold increase or decrease in the probability of occurrence (Table 4). The scores indicate a rate per year, so that:
|
Annual occurrence rate = 10Likelihood score |
(1) |
Hence a likelihood score of –2 (rare) equates to a predicted annual occurrence probability (or annual frequency) of 10−2, which equals 1/100 or 0.01. Note that the likelihood of a hazard occurring can be readily defined in a much more precise manner than its associated impact. It is therefore easier to compare the likelihood scores with actual outcomes and thereby calibrate the experts’ opinions if data on the hazard (e.g. the incidence of failure of well integrity) are available.
2.3.3.3 Detection
The probability of detection, or time to detection, is very different from the probability of occurrence. It was scored in the same fashion as the likelihood score but on a scale specifically developed for the IMEA (Table 5). Again these definitions are readily defined in a precise manner; hence these scores can also be calibrated against real-world outcomes given appropriate datasets.
Table 3 Environmental consequence (severity) levels and their corresponding scores
|
Impact level |
Environment |
Severity score |
|---|---|---|
|
None |
No impact |
3 |
|
Tiny |
Minimal impact on ecosystem; contained on mining lease, reversible in 1 year |
4 |
|
Minimal |
Moderate impact on ecosystem; contained on mining lease, reversible in 1 to 5 years |
5 |
|
Minor |
Moderate impact on ecosystem; contained on mining lease, reversible in 5 to 10 years |
6 |
|
Moderate |
Significant impact on ecosystem; impact at level of exploration lease, reversible in ~10 years |
7 |
|
Major |
Significant harm or irreversible impact (for example to World Heritage area); widespread, catchment area, long term, greater than 10 years |
8 |
|
Catastrophic |
Incident(s) due to unforeseen circumstances causing significant harm or irreversible impact (for example to World Heritage area); widespread, long term |
9 |
Modified from Lin et al. (2013) and Adani Mining Pty Ltd (2013)
Table 4 Likelihood, indicative recurrence and associated likelihood score
|
Likelihood |
Indicative recurrence |
Likelihood score |
|---|---|---|
|
Extremely rare |
One event in 1000 years |
–3 |
|
Very rare |
One event in 333 years |
–2.5 |
|
Rare |
One event in 100 years |
–2 |
|
Very unlikely |
One event in 33 years |
–1.5 |
|
Unlikely |
One event in 10 years |
–1 |
|
Possible |
One event in 3 years |
–0.5 |
|
Likely |
One event in 1 year |
0 |
|
Almost certain |
Three events in 1 year |
0.5 |
|
Most certain |
Ten events in 1 year |
1 |
|
Frequently |
33 events in 1 year |
1.5 |
|
Very frequently |
100 events in 1 year |
2 |
|
Every day |
365 events in 1 year |
2.5 |
Table 5 Detection, indicative days to detect, and associated detection score
|
Detection |
Indicative days to detection |
Detection score |
|---|---|---|
|
Almost impossible |
33,333 days |
4.5 |
|
Extremely hard |
10,000 days |
4 |
|
Very hard |
3,333 days |
3.5 |
|
Hard |
1,000 days |
3 |
|
Quite hard |
333 days |
2.5 |
|
Easy |
100 days |
2 |
|
Quite easy |
33 days |
1.5 |
|
Very easy |
10 days |
1 |
|
Almost same day |
3 days |
0.5 |
|
Same day |
1 day (within 24 hours) |
0 |
|
Less than a day |
0.3 of a day (<8 hours) |
–0.5 |
2.3.4 Hazard ranking
Hazards identified by the IMEA can be ranked according to the hazard priority number (Equation 2) or the hazard score (Equation 3). Ranking according to hazard priority number is the traditional or ‘reactive’ approach to prioritise management actions, whereas ranking according to hazard score is referred to as the ‘proactive’ approach because it aims to reduce the likelihood and severity of impact modes before allocating resources to improve detection (Palady, 1995).
|
Hazard priority number = severity score + likelihood score + detection score |
|
|
Hazard score = severity score + likelihood score |
As noted in Section 2.3.3, FMEA scores are normally based on a single elicited value. In the IMEA, however, experts are allowed to provide an interval (see Section 2.3.3). The additional information provided by the interval provides a number of alternative options for calculating the overall score of any given hazard. Several potential alternatives were considered, including ranking by:
- lowest, midpoint or highest hazard score or hazard priority number
- lowest, midpoint or highest hazard score or hazard priority number weighted according to the inverse of the range of the score.
The range of the hazard score or hazard priority number may be interpreted as a measure of the experts’ certainty; hence weighting by the inverse of the range places greater emphasis on the hazards that the experts are more certain of (i.e. those that have a smaller range). Ranking hazards in this manner, however, overemphasised a large number of low-priority hazards and was considered misleading. As a result, this manner of ranking hazards was not pursued further.
A high hazard priority number may result from average severity and likelihood scores, and high detection score (difficult to detect), whereas a lower ranking may occur from high severity and likelihood scores, but low detection score (easy to detect). Although this is entirely within the scope of the hazard analysis, the hazard priority number can mask the potential importance of hazards with high severity and likelihood. Comparing the hazard priority number to the hazard score, which focuses only on the severity and likelihood of the impact modes, helps avoid this. As such, hazards were ranked by the midpoint of the hazard score and midpoint of the hazard priority number.
2.3.5 Reporting the hazard analysis
The results of the hazard analysis are reported in product 2.3 (conceptual modelling). See Chapter 4 in the companion submethodology M05 (as listed in Table 1) for developing a conceptual model of causal pathways (Henderson et al., 2016) for guidance on which content to include. Examples of recommended outputs – and the way to present the outputs – are provided in the case study described in Chapter 3, Appendix A and Appendix B.
In addition, the full output of the hazard analysis will be registered as a dataset and cited in product 2.3 (conceptual modelling), to ensure transparency with respect to the underpinning results.
