This submethodology was trialled using the Gloucester subregion as a case study. The results are presented in this chapter (and in Appendix A and Appendix B) as an illustration of how to apply this submethodology in practice.
Unique activities for CSG operations and open-cut coal mines are listed in Appendix B. The IMEA activities are a complete list of all the things that occur during each life-cycle stage of a CSG operation and open-cut coal mining, starting with (for example) ground-based geophysics during the exploration and appraisal life-cycle stage of a CSG operation, through to pressure concrete completion during the decommissioning life-cycle stage. These activities are the core of the IMEA analysis and represent the source of potential hazards associated with CSG operations and open-cut coal mines.
A total of 261 activities were identified for CSG operations, and 351 activities for open-cut coal mines. Although these were all activities identified during the IMEA, the results described in Section 3.1 are based on a subset of activities with complete scores. Although all decisions were recorded, some activities were left unscored if there was incomplete information, or if they were considered not applicable to the case study for the Gloucester subregion.
Activities and impact modes were addressed for CSG and open-cut coal mining operations. Underground mining, however, is not currently planned for the Gloucester subregion. As a result, most of the impact modes for this activity were not completed in this case study.
Furthermore, as the participants identified hazards they were also requested to explicitly identify the associated stressors (i.e. the physical, biological or chemical process or contaminant that causes the effect). This was a deliberate strategy designed to identify and clarify the stressors that potentially threaten water-dependent assets, and hence may need to be ‘in scope’ for the purposes of the BAs.
3.1 Coal seam gas operations
3.1.1 Effects, stressors and impact causes
The results analysis begins by compiling all the unique effects identified during the IMEA (see Table 12, Appendix A). The objective here is to identify all the possible ways (the unique effects) in which surface water and groundwater assets may be influenced by CSG activities. It is important to note that each hazard may have multiple effects and thus the total count of unique effects will differ from unique hazards.
The potential impacts on water-dependent assets identified by the IMEA were grouped into 11 unique categories, including impacts on surface water and groundwater quality, quantity and composition (see Table 12, Appendix A; note that groundwater composition refers to the degree of mixing of groundwaters of different composition (in terms of natural dissolved solids)). Of these, impacts on surface water quality were the most frequently identified (117) followed by impacts on groundwater quality (50), surface water volume (25) and groundwater quantity (14).
The next compilation step in the results analysis is to list all the unique stressors. The objective here is to identify all the possible changes to, or contaminants of, groundwater and surface water in order to identify what variables would need to be modelled if these stressors were to be included within a probabilistic risk assessment. Note, however, that a full risk assessment is outside the scope of a BA; instead, a BA identifies and analyses risks, then others can use these for their own full risk assessment.
For the purposes of the BA, some of these stressors will be considered in scope and some will not. By listing all stressors, the hazard analysis provides a transparent statement of what is in scope and out of scope for the BA. Some of the stressors that are deemed in scope will become (perhaps in a more detailed characterisation) the hydrological response variables, the hydrological characteristics of the system that potentially change due to coal resource development (Viney, 2016; Crosbie et al., 2016). The impact and risk analysis is conditioned upon these hydrological response variables.
In most cases the unique stressors provide additional detail to the identified effects. For example the particular pollutants that may cause changes in surface water or groundwater quality are listed. A specific example is shown in Figure 6 where there is potentially a change in water quality (an effect) following vegetation clearance with a particular stressor related to total suspended solids (TSS). In some instances, however, the precise stressor is unspecified, or the stressor and associated effect are the same. The latter indicates that the change to water-dependent asset is the stressor.
The unique stressors identified during the IMEA for CSG operations in the Gloucester subregion, together with the frequency with which they were identified during the analysis indicate the most commonly cited were: TSS, pollutants (including metals, trace elements, sulfides and phosphorus), salts (expressed as total dissolved solids (TDS)), hydrocarbons and changes to surface water flow (see Table 13, Appendix A).
The last compilation step in the results analysis is to list all of the unique impact causes. This step has two objectives: (i) to separate deliberate or inevitable events from accidental events and (ii) to gauge their importance by the number of times each impact cause is cited. To carry accidental impacts forward requires the analyst to quantify their annual (for example) frequency. This step is not necessary for inevitable or deliberate events, hence impact and risk analysis for the latter is simpler.
The unique impact causes, together with the frequency that they were identified during IMEA for CSG operations in the Gloucester subregion, suggest:
- A good proportion of the hazards associated with CSG operations were attributed to accidental incidents or human error.
- Litter and spills associated with ground support operations are a potential source of hazards in many contexts, but these hazards were deemed to be of a very low priority and well managed given current controls.
- Containment failure, leaching, or flooding were also frequently cited, whether by lining material failure, plant or mechanical failure, or pipe fatigue.
- Removal of vegetation and diversion of site drain lines are cited relatively frequently in the list of potential impact causes. Their potential impacts are not deemed negligible (due to the potential for weed invasion, habitat fragmentation and soil erosion) but neither do they rank in the top hazards (see below). By virtue of their frequency these types of impacts may warrant additional attention in relation to the potential for cumulative effects.
3.1.2 High-priority hazards
The overall hazard score and hazard priority number provide a means to rank hazards relative to each other. Ranking hazards in this fashion allows the analyst to focus attention on the impact causes and/or stressors that were deemed most important by the experts involved in the IMEA. The ranking also provides a formal mechanism for recording the overall priority of hazards that are not carried forward.
The analysis identified impacts upon aquifers as the highest ranked hazard associated with CSG operations in the Gloucester subregion. The analysis identifies at least five ways in which aquifer impacts may occur including:
- fault-mediated depressurisation and pressurisation – caused by faults opening or closing due to CSG operations
- aquitard mediated depressurisation – an aquitard is absent (i.e. the coal seam is linked to the aquifer)
- aquitard mediated depressurisation – the integrity of the aquitard is compromised
- coal seam mediated depressurisation – the coal seam is part of the aquifer and it is deliberately depressurised
- connecting previously separated aquifers by (incorrect) hydraulic fracturing or incomplete well casings.
After impacts upon aquifers, the potential hazards associated with using production water for irrigation rate as high priority hazards. Increased discharges to surface water, raised groundwater levels, soil salt mobilisation and changes to soil chemistry were all identified as potentially important in this context.
Table 6 and Table 7 list the 30 highest ranked hazards, by hazard score (Table 6) and hazard priority number (Table 7), together with their associated stressors and frequency in the top 30. Figure 8 shows the 30 highest ranked hazardous activities and impact modes by hazard priority number mid-point. The figure also shows the lowest and highest hazard priority number and hazard score values for these hazards. Disruption of natural surface drainage was the most frequently identified hazard in the top 30 highest ranked hazards. This hazard appears 24 times in the Gloucester subregion CSG IMEA and 8 times in the top 30 hazards. It appears so frequently because many of the activities associated with CSG operations – such as site vegetation removal and diverting site drain lines – lead to this type of impact mode. This activity is identified as hazardous as it may lead to impacts upon surface water volume, direction and quality, and in extreme cases impacts upon groundwater quantity, which was also identified as a possible outcome.
Other high priority CSG hazards identified for the Gloucester subregion were:
- gas leakage into groundwater caused by incomplete or compromised cement casing
- subsidence
- leaching from brine storage ponds, pumps, water disposal pipelines and hypersaline brine ponds
- soil erosion following heavy rainfall, with TSS as the associated stressor
- inevitable loss of seal integrity after decommissioning of CSG wells.
The overall distribution of hazard priority number and hazard scores are shown in Figure 9. The dashed lines indicate the top 30 scores as displayed in Table 6 and Table 7. This is an arbitrary cut-off, used to identify the top ranked hazards for communication purposes. This selection is not intended to imply that these hazards are the only important hazards for consideration.
Table 6 Frequency of occurrence of impact mode, and associated stressors, for top 30 impact modes (as ranked by hazard score) from coal seam gas in the Gloucester subregion
Rows are ranked by frequency in the top 30.
|
Impact mode |
Stressors |
Frequency in top 30 |
|---|---|---|
|
Soil erosion following heavy rainfall |
TSS |
6 |
|
Disruption of natural surface drainage |
TSS, SW flow, GW flow |
5 |
|
Aquifer depressurisation |
Change in GW pressure |
1 |
|
Aquifer depressurisation (aquitard-absent) |
Change in GW pressure |
1 |
|
Aquifer depressurisation (coal seam) |
Change in GW pressure |
1 |
|
Aquifer depressurisation (fault-mediated) |
Change in GW pressure |
1 |
|
Aquifer depressurisation (loss of aquitard integrity) |
Change in GW pressure |
1 |
|
Aquifer pressurisation (fault-mediated) |
Change in GW pressure increase |
1 |
|
Changing target aquifer properties (physical or chemical) |
Aquifer properties |
1 |
|
Connecting aquifers |
GW composition, hydrocarbons |
1 |
|
Containment failure |
TSS, TDS pH, pollutants (e.g. metals, trace elements, sulfides or phosphorous) |
1 |
|
Contaminate target aquifer (chemical) |
Hydraulic fracturing chemicals |
1 |
|
Incomplete or compromised cementing/casing (gas leakage) |
TDS, hydrocarbons |
1 |
|
Incomplete or compromised cementing/casing (linking aquifers) |
GW composition, hydrocarbons |
1 |
|
Increase discharge to rivers following irrigation |
TDS, SW flow |
1 |
|
Leaching from storage ponds |
TDS |
1 |
|
Overflow and/or loss of containment |
TSS, drilling mud products, TDS |
1 |
|
Raise watertable following irrigation |
TDS, GW flow |
1 |
|
Soil chemistry changes following irrigation |
Soil quality |
1 |
|
Soil salt mobilisation following irrigation |
TDS |
1 |
|
Subsidence |
Subsidence |
1 |
TSS = total suspended solids; SW = surface water; GW = groundwater; TDS = total dissolved solids
Table 7 Frequency of occurrence of impact mode, and associated stressors, for top 30 impact modes (as ranked by hazard priority number) from coal seam gas in the Gloucester subregion
Rows are ranked by frequency in the top 30.
|
Rows ranked by frequency in the top 30 impact modes |
Stressors |
Frequency in top 30 |
|---|---|---|
|
Disruption of natural surface drainage |
TSS, SW flow, GW flow |
8 |
|
Leaking |
TSS, TDS, pH, pollutants (e.g. metals, trace elements, sulfides or phosphorous) |
2 |
|
Soil erosion following heavy rainfall |
TSS |
2 |
|
Aquifer depressurisation |
Change in GW pressure |
1 |
|
Aquifer depressurisation (aquitard absent) |
Change in GW pressure |
1 |
|
Aquifer depressurisation (coal seam) |
Change in GW pressure |
1 |
|
Aquifer depressurisation (fault mediated) |
Change in GW pressure |
1 |
|
Aquifer depressurisation (loss of aquitard integrity) |
Change in GW pressure |
1 |
|
Aquifer pressurisation (fault mediated) |
Change in GW pressure increase |
1 |
|
Connecting aquifers |
GW composition, hydrocarbons |
1 |
|
Contaminate non-target aquifer (chemical) |
Hydraulic fracturing chemicals |
1 |
|
Incomplete seal |
TDS, hydrocarbons |
1 |
|
Incomplete or compromised cementing/casing (gas leakage) |
TDS, hydrocarbons |
1 |
|
Incomplete or compromised cementing/casing (linking aquifers) |
GW composition, hydrocarbons |
1 |
|
Increase discharge to rivers following irrigation |
TDS, SW flow |
1 |
|
Leaching from storage ponds |
TDS |
1 |
|
Raise watertable following irrigation |
TDS, GW flow |
1 |
|
Seal integrity loss |
TDS, hydrocarbons |
1 |
|
Soil chemistry changes following irrigation |
Soil quality |
1 |
|
Soil salt mobilisation following irrigation |
TDS |
1 |
|
Subsidence |
Subsidence |
1 |
TSS = total suspended solids; SW = surface water; GW = groundwater; TDS = total dissolved solids
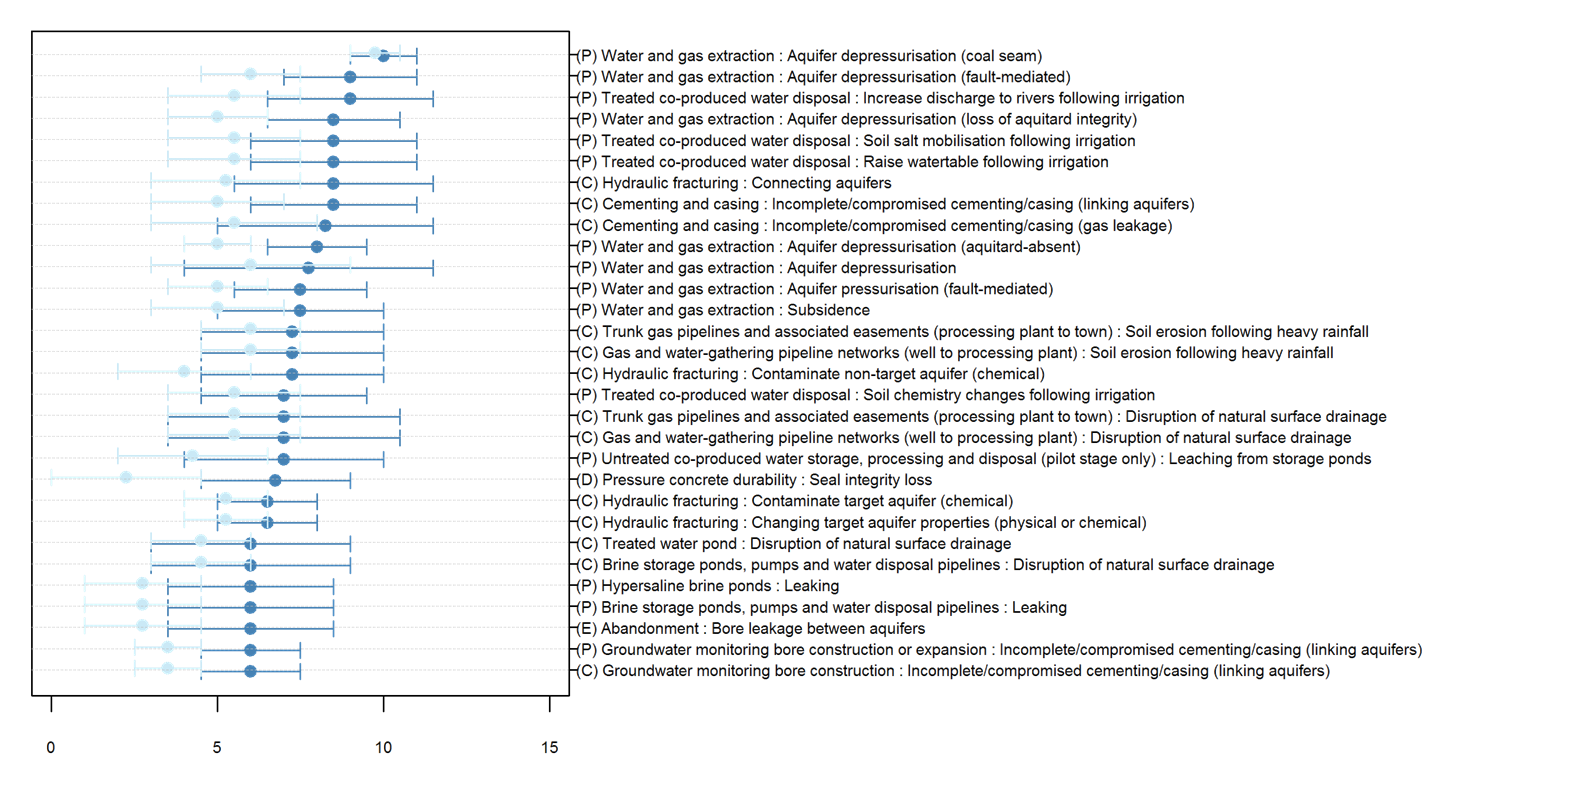
Figure 8 Highest ranked hazards (and their associated activities and impact modes) for coal seam gas operations in the Gloucester subregion, ranked by midpoint of hazard priority number
The x-axis shows the hazard priority number and hazard score for potential hazards. The intervals between the highest and lowest hazard priority number are shown in dark blue; the intervals for hazard score are shown in light blue. The same hazard may appear multiple times, as it may arise from a number of different life-cycle stages and activities. Hazards are listed with the syntax [Life‑cycle stage][Activity]:[Impact mode], where life-cycle stages are indicated by (E) for exploration and appraisal, (D) for development, (P) for production, (C) for closure and (R) for rehabilitation.
This figure has been optimised for printing on A3 paper (420 mm x 297 mm).
|
(a) Hazard priority number |
(b) Hazard score |
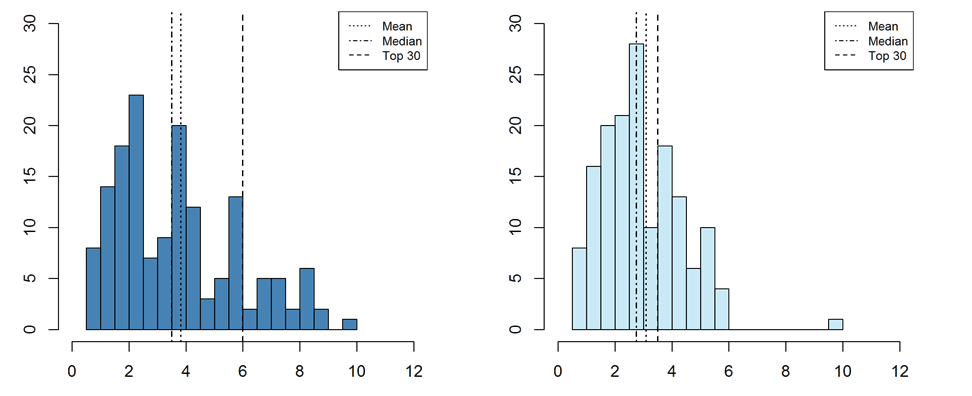
Figure 9 Histogram of (a) hazard priority number and (a) hazard score for coal seam gas operations in the Gloucester subregion
The x-axis shows the hazard priority number (a) and hazard score (b) respectively. The y-axis shows the frequency. Three dashed lines indicate the mean, median and top 30 ranked hazards as identified in the legend in the top right of each figure.
3.2 Open-cut coal mines
3.2.1 Effects, stressors and impact causes
The results analysis begins by compiling all the unique effects identified during the IMEA. The objective is to identify all the possible ways (the unique effects) in which surface water and groundwater assets may be influenced by open-cut coal mining activities. It is important to note that each hazard may have multiple effects and thus the total count of unique effects will differ from unique hazards.
The potential impacts of open-cut coal mining on water-dependent assets in the Gloucester subregion were grouped into 13 unique effect categories, including impacts on surface water quality, volume/quantity, direction and flow; and impacts on groundwater quality, quantity/volume, pressure, composition and directional characteristics (see Table 15, Appendix A). Of these, as with CSG, impacts on surface water quality was the most frequently identified impact (95) followed by groundwater quality (43), surface water directional characteristics (including flow paths, direction and drainage patterns) (23) and surface water volume/quantity (18).
The unique stressors identified during the IMEA for open-cut coal mining, together with the frequency with which they were identified during the analysis indicate the two most frequently identified stressors are TSS (72) and pollutants (including metals, trace elements, sulfides and phosphorus) (42). Following these, the next most common stressors are changes to surface water flow, salts (expressed as TDS), hydrocarbons and pH changes.
The unique impact causes, together with the frequency that they were identified during the IMEA for open-cut coal mining in the Gloucester subregion indicate the most frequently cited impact causes are similar to the CSG components, namely:
- A good proportion of the hazards associated with open-cut coal mining operations were attributed to accidental incidents or human error.
- Removal of vegetation and diversion of site drain lines are cited relatively frequently in the list of potential impact causes. Their potential impacts are not deemed negligible (due to the potential for weed invasion, habitat fragmentation and soil erosion) but neither do they rank in the top hazards (see below).
- Litter and spills associated with ground support operations are a potential source of hazards in many contexts, but again these hazards were deemed to be of a very low priority and well managed given current controls.
- Containment failure, leaching, or flooding were also frequently cited, whether by lining material failure, plant or mechanical failure, or pipe fatigue.
3.2.2 High-priority hazards
Table 8 and Table 9 list the 30 highest ranked impact modes, by hazard score and hazard priority number respectively, together with their associated stressors and citation frequencies. There are fewer unique impact modes in the top 30 for open-cut coal mining, compared to CSG operations, with multiple impact modes occurring several times. Figure 10 plots the 30 highest ranked hazardous activities by hazard score and hazard priority number midpoint. The figure also shows the lowest and highest hazard priority number and hazard score values for these activities.
The analysis identifies disruption of, and changes to, natural surface drainage and runoff as some of the most important impact modes associated with open-cut coal mining. These potential impact modes are listed six times in the top 30 hazards, and occur because open-cut coal mines may potentially divert rivers and creeks, and divert the natural direction of rainfall-runoff by the construction (or expansion of) the pit, as well as by re-contouring landforms.
The potential impact of leaching is another important hazard, featuring seven times in the top 30 hazards (Table 9). The most important potential impacts of leaching were leaching from in pit waste rock dumps, leaching from waste rock dumps outside of the pit, leaching from coal stockpiles (in and out of the pit) and from run-of-mine (ROM) plants (Figure 10).
Incomplete or compromised cementing casing of groundwater monitoring bores, supply bores, mine dewatering bores and abandoned exploration and appraisal bores were identified as having the potential to link, or cause leakage between, aquifers. This – together with deliberate pit wall dewatering, subsidence, and enhanced aquifer interconnectivity caused by post-closure water filling the pit – were also identified as potentially important hazards. The remaining top 30 hazards include soil erosion caused by heavy rainfall or failure to successfully rehabilitate abandoned mines, artificial groundwater recharge (following pit abandonment), groundwater and surface water contamination via drill cutting disposal or negligent decontamination of mines post-closure.
When prioritised by hazard score, soil erosion following heavy rainfall, with TSS as the stressor, was the most frequent high-priority hazard. Following this was leaching, changes to natural surface drainage and erosion. TSS was a stressor in all but four of the top 30 impact modes when ranked by hazard score. When detection is accounted for, with impact modes prioritised by hazard priority number, leaching (difficult to detect) was the most frequent cited high-priority hazard, followed by disruption to natural surface drainage, erosion and incomplete or compromised cement casing (leading to linking of aquifers).
The overall distribution of hazard priority number and hazard scores is shown in Figure 11. The dashed lines indicate the top 30 scores as displayed in Table 8 and Table 9.
Table 8 Frequency of occurrence of impact mode, and associated stressors, for top 30 impact modes (as ranked by hazard score) from open-cut coal mines in the Gloucester subregion
Rows are ranked by frequency in the top 30.
|
Impact mode |
Stressors |
Frequency in top 30 |
|---|---|---|
|
Soil erosion following heavy rainfall |
TSS |
6 |
|
Erosion |
TSS, SW flow |
3 |
|
Leaching |
TSS, TDS, pH, pollutants (e.g. metals, trace elements, sulfides or phosphorous) |
3 |
|
Change to natural surface drainage |
TSS, SW flow, GW flow |
2 |
|
Disruption of natural surface drainage |
TSS, SW flow, GW flow |
2 |
|
Equipment failure: pipe failure between pit and dam |
TSS, Pollutants (e.g. metals, trace elements, sulfides or phosphorous) |
2 |
|
Failure of the storage: slope failure |
SW flow |
2 |
|
Leaching: waste storage |
TSS, TDS, pH, Pollutants (e.g. metals, trace elements, sulfides or phosphorous) |
2 |
|
Containment failure |
TSS, TDS, pH, Pollutants (e.g. metals, trace elements, sulfides or phosphorous) |
1 |
|
Deliberate |
GW flow, change in GW pressure |
1 |
|
Disruption of natural surface drainage: Pit |
TSS, SW flow, GW flow |
1 |
|
Disruption of natural surface drainage: Pit - expansion |
TSS, SW flow, GW flow |
1 |
|
Enhanced aquifer interconnectivity |
TSS, TDS, pH, pollutants (e.g. metals, trace elements, sulfides or phosphorous) |
1 |
|
Equipment failure (pipe) |
TSS, TDS, pH, pollutants (e.g. metals, trace elements, sulfides or phosphorous) |
1 |
|
Leaching: in pit waste rock dump |
TSS, TDS, pH, pollutants (e.g. metals, trace elements, sulfides or phosphorous) |
1 |
|
Runoff changes |
GW quantity or volume, SW volume or quantity |
1 |
TSS = total suspended solids; SW = surface water; GW = groundwater; TDS = total dissolved solids
Table 9 Frequency of occurrence of impact mode, and associated stressors, for top 30 impact modes (as ranked by hazard priority number) from open-cut coal mines in the Gloucester subregion
Rows are ranked by frequency in the top 30.
|
Impact mode |
Stressors |
Frequency in top 30 |
|---|---|---|
|
Leaching |
TSS, TDS, pH, pollutants (e.g. metals, trace elements, sulfides or phosphorous) |
4 |
|
Erosion |
TSS, SW flow |
3 |
|
Incomplete or compromised cementing/ casing (linking aquifers) |
GW composition, hydrocarbons |
3 |
|
Change to natural surface drainage |
TSS, SW flow, GW flow |
2 |
|
Disruption of natural surface drainage |
TSS, SW flow, GW flow |
2 |
|
Leaching: waste storage |
TSS, TDS, pH, pollutants (e.g. metals, trace elements, sulfides or phosphorous) |
2 |
|
Artificial point of recharge |
GW quantity or volume |
1 |
|
Bore leakage between aquifers |
GW composition, hydrocarbons |
1 |
|
Bore leakage to surface |
SW composition, hydrocarbons |
1 |
|
Creation of artifical lake |
TSS, TDS, pH, Pollutants (e.g. metals, trace elements, sulfides or phosphorous) |
1 |
|
Deliberate |
GW flow, change in GW pressure |
1 |
|
Disruption of natural surface drainage: Pit |
TSS, SW flow, GW flow |
1 |
|
Disruption of natural surface drainage: pit – expansion |
TSS, SW flow, GW flow |
1 |
|
Enhanced aquifer interconnectivity |
TSS, TDS, pH, pollutants (e.g. metals, trace elements, sulfides or phosphorous) |
1 |
|
Equipment failure (pipe) |
TSS, TDS, pH, pollutants (e.g. metals, trace elements, sulfides or phosphorous) |
1 |
|
GW and/or SW contamination |
TSS, drilling mud products, TDS |
1 |
|
Leaching: in pit waste rock dump |
TSS, TDS, pH, pollutants (e.g. metals, trace elements, sulfides or phosphorous) |
1 |
|
Negligence |
Pollutants (e.g. metals, trace elements, sulfides or phosphorous), hydrocarbons |
1 |
|
Runoff changes |
GW quantity or volume, SW volume or quantity |
1 |
|
Subsidence |
Subsidence |
1 |
TSS = total suspended solids; SW = surface water; GW = groundwater; TDS = total dissolved solids
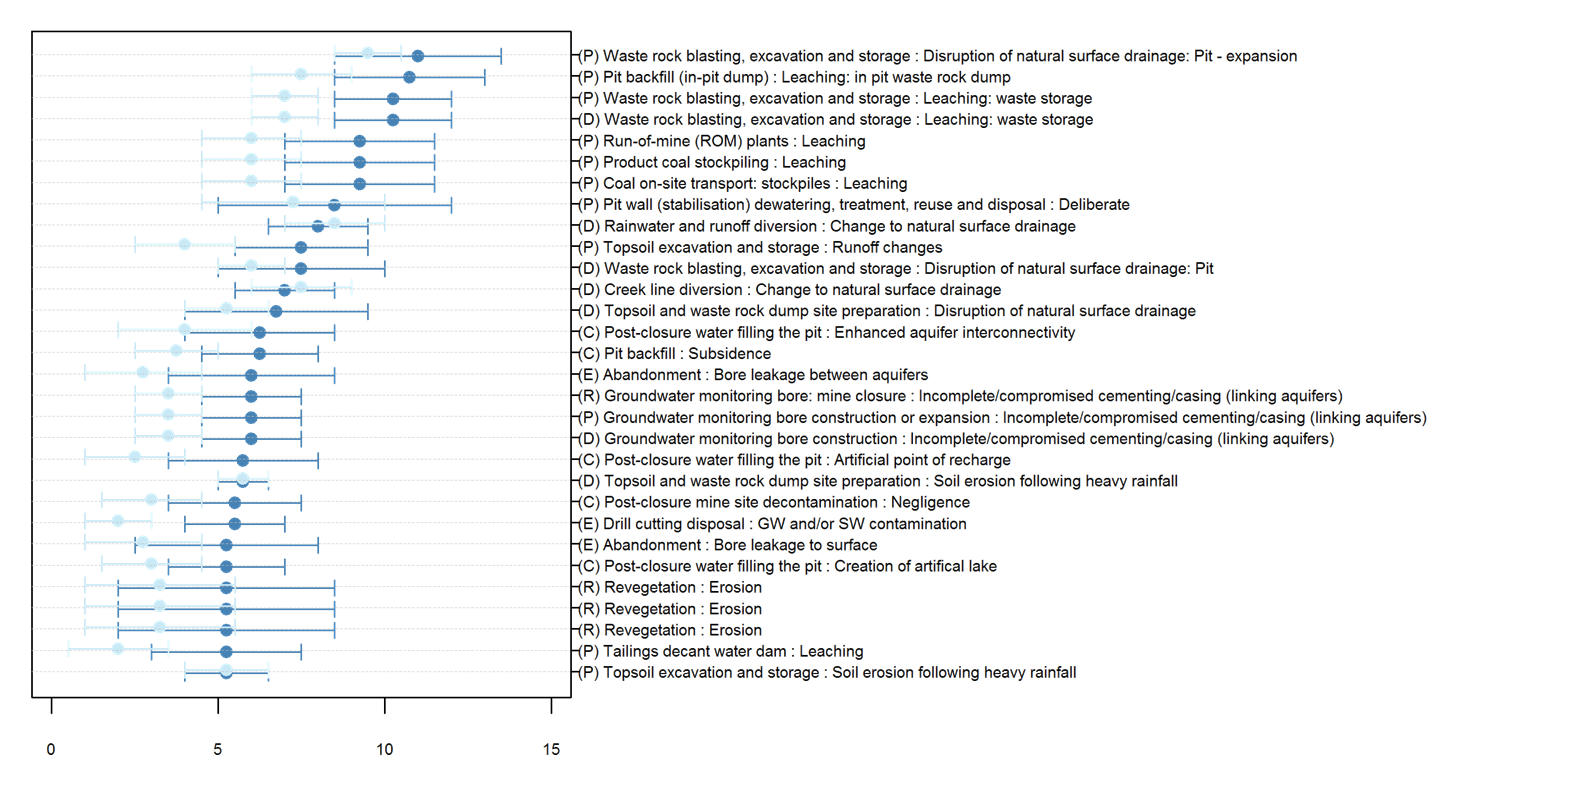
Figure 10 Highest ranked hazards (and their associated activities and impact modes) for open-cut coal mines in the Gloucester subregion, ranked by midpoint of hazard priority number
The x-axis shows the hazard priority number and hazard score for potential hazards. The intervals between the highest and lowest hazard priority number are shown in dark blue; the intervals for hazard score are shown in light blue. The same hazard may appear multiple times, as it may arise from a number of different life-cycle stages and activities. Hazards are listed with the syntax [Life‑cycle stage][Activity]:[Impact mode], where life-cycle stages are indicated by (E) for exploration and appraisal, (D) for development, (P) for production, (C) for closure and (R) for rehabilitation.
This figure has been optimised for printing on A3 paper (420 mm x 297 mm).
|
(a) Hazard priority number |
(b) Hazard score |
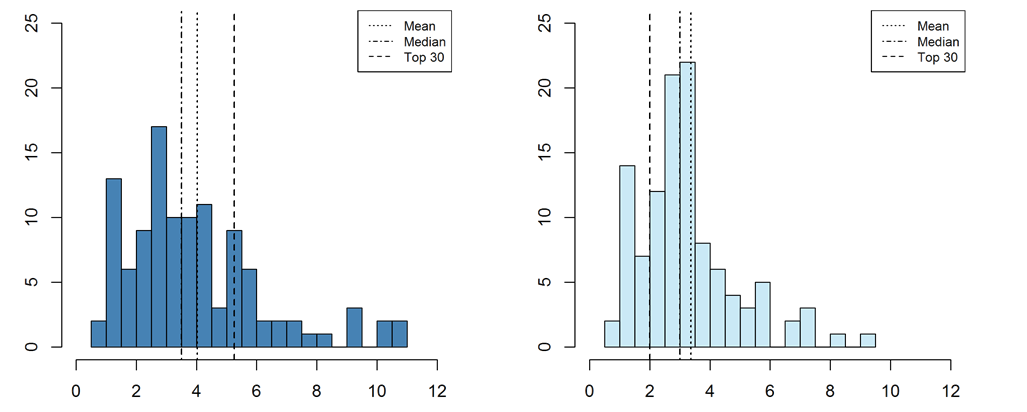
Figure 11 Histogram of (a) hazard priority number and (b) hazard score for open-cut coal mines in the Gloucester subregion
The x-axis shows the hazard priority number (a) and hazard score (b) respectively. The y-axis shows the frequency. Three dashed lines indicate the mean, median and top 30 ranked hazards as identified in the legend in the top right of each figure.
