- Home
- Assessments
- Bioregional Assessment Program
- Galilee subregion
- 5 Outcome synthesis for the Galilee subregion
- What are the potential hydrological changes?
Potential hydrological changes were modelled for seven coal mines using regional-scale surface water and groundwater models. Potential impacts to water-dependent ecosystems and assets that rely on access to the near-surface aquifer are limited to the zone of potential hydrological change (Figure 1 and Box 5). Modelling indicates that potential impacts to two deeper (confined) groundwater layers extend beyond the zone, and may affect some bores associated with two economic assets (see Economic assets).
The zone of potential hydrological change covers an area of 14,030 km2 (2% of the assessment extent) and includes 6,285 km of streams. The zone occurs mainly in the Belyando river basin, a headwater catchment of the larger Burdekin River. Cumulative hydrological changes in the Belyando river basin are very likely (Figure 8). These changes affect a larger area of groundwater drawdown in the near-surface aquifer, and total length of streams, than previously predicted from any individual mine-scale impact assessments.Key finding 2
Key finding 3
Groundwater
The assessment investigated drawdown due to additional coal resource development in the three main aquifer systems of the central-eastern Galilee Basin (Box 3). These are the near-surface Quaternary alluvium and Cenozoic sediment layer, and the deeper Clematis Group aquifer and the upper Permian coal measures. The models provide a range of possible drawdown values for the near-surface aquifer where water-dependent ecosystems and assets may access water, as well as for the two deeper (confined) groundwater systems, where drawdown may affect some bores and springs.
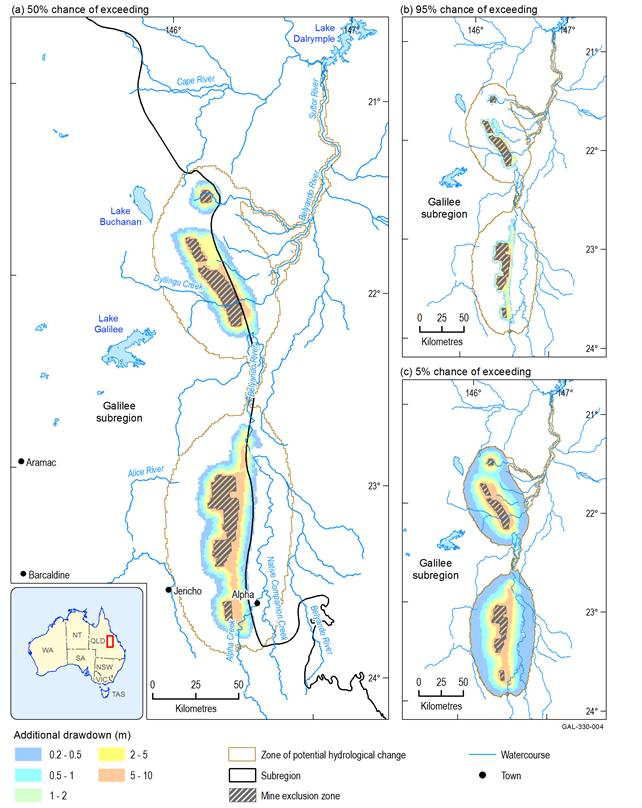
Drawdown in the near-surface aquifer due to the modelled additional coal resource development has a 5% chance of affecting up to 13,364 km2. Drawdown occurs in two separate areas, located near the central-eastern margin of the Galilee subregion (Figure 8). In these areas, cumulative groundwater changes in the near-surface aquifer may occur over space and time, due mainly to the interaction of dewatering multiple coal mining operations. In particular, Figure 8 clearly indicates that cumulative groundwater drawdown impacts between multiple mining operations are very likely (greater than 95% chance) to occur across all four proposed mines in the southern area, and also across the Carmichael and China Stone mines in the north.
Proposed coal mines at South Galilee, China First, Alpha and Kevin’s Corner result in drawdown in the near-surface aquifer exceeding 0.2 m in an area that is very likely to exceed 1663 km2 and very unlikely to exceed 7898 km2. Further north, the proposed Carmichael, China Stone and Hyde Park coal mines result in drawdown in the near-surface aquifer exceeding 0.2 m in an area that is very likely to exceed 1157 km2 and very unlikely to exceed 5466 km2. For this assessment, the hydrological change due to additional coal resource development is probabilistically estimated with a groundwater analytic element model (Peeters et al., 2018). The groundwater model itself is based on a simplified hydrogeological conceptualisation of the main aquifers and aquitards (Section 3.2.3 in Lewis et al. (2018)) that occur in and around the seven modelled coal mines. This modelling approach is well suited to regional-scale cumulative impact analysis, and the fast model run times allow for the evaluation of a very wide range of parameter combinations, and support the assessment’s comprehensive uncertainty analysis. The models cover a 90-year period from 2013 to 2102. The groundwater model is not suitable for highly accurate local-scale predictions of drawdown within the zone of potential hydrological change due to the relatively low-resolution regional-scale conceptualisation that underpins the drawdown predictions. At some locations, a relatively simple change in the conceptualisation that underpins the analytic element model can produce substantially different results (Peeters et al., 2018). To reveal the extent to which alternative conceptual models can influence drawdown within the zone, the analytic element model was run for two different approaches (see Section 2.6.2.8 in Peeters et al. (2018)). The first approach (original conceptualisation) allows for drawdown and drainage of shallow aquifers that may occur due to excavation of open-cut mine pits through the near-surface layers, as well as drawdown that can propagate laterally from the deeper coal-bearing unit to shallower aquifers through any intervening layers. The alternative conceptualisation assumes that open-cut mine developments have no direct interaction with the near-surface aquifers, except via drawdown propagating vertically upwards from the deeper coal-bearing layer through any intervening aquifers and aquitards. Throughout this synthesis and the impact and risk analysis, the results from the original groundwater conceptualisation are mostly reported. However, for specific ecological assets, the analysis presented (see Section 3.4 and Section 3.5 of Lewis et al. (2018)) may use the groundwater results from the alternative conceptualisation where the assessment team considers that these results are more locally appropriate. For example, in the ’Springs' landscape group (Section 3.5.2.6 in Lewis et al. (2018)) the results from two groundwater model conceptualisations are compared to better understand the likely groundwater responses for some spring-related assets.Key finding 4
Box 3 Understanding the groundwater model
In the near-surface aquifer, modelling suggests that maximum drawdowns exceeding 5 m only occur very close to the mines (within several kilometres), and that this will usually occur sometime after 2050. Beyond about 20 km from the mine sites, the probability of exceeding a drawdown of 0.2 m is small (Figure 8). Drawdowns predicted in the upper Permian coal measures (the main coal-bearing layer targeted for mining) decrease rapidly with increasing distance from the mines, although maximum drawdown is generally in excess of 5 m throughout the area modelled.
Queensland’s Water Act 2000 specifies drawdown thresholds that may trigger management responses for groundwater resources (2 m for unconsolidated aquifers and 5 m for consolidated rock aquifers). Relevant regional-scale modelling results for the near-surface aquifer are as follows:
- Around the proposed South Galilee, China First, Alpha and Kevin’s Corner coal mines, the area where additional drawdown is greater than 2 m is very likely to exceed 940 km2 and very unlikely to exceed 2623 km2, with a 50% chance of drawdown exceeding 2 m for an area of 1617 km2 (Figure 8).
- Around the proposed Carmichael, China Stone and Hyde Park coal mines, the area where additional drawdown is greater than 2 m is very likely to exceed 657 km2 and very unlikely to exceed 1803 km2, with a 50% chance of drawdown exceeding 2 m for an area of 1100 km2 (Figure 8).
Results from regional-scale groundwater modelling of the near-surface aquifer are reported in Section 3.3 of the impact and risk analysis (Lewis et al., 2018), focusing on three drawdown thresholds of 0.2, 2 and 5 m (Box 3). Further information about modelled drawdowns for the Clematis Group aquifer and upper Permian coal measures are reported in Section 3.4 and Section 3.5 of Lewis et al. (2018). The results for these two deeper aquifers are used to assess potential impacts to some springs, as well as groundwater bores (which are part of various economic assets). Notably, the assessment of potential drawdown impacts for some water-dependent assets that rely on access to the Clematis Group aquifer may use results from an alternative groundwater model conceptualisation (Box 3).
Drawdown is a lowering of the groundwater level, caused, for example, by pumping. The groundwater model (Box 3) predicted drawdown under the coal resource development pathway and drawdown under the baseline (baseline drawdown), which in this case, has no development. The difference in drawdown between the coal resource development pathway and baseline (referred to as additional drawdown) is due to additional coal resource development. In a confined aquifer, drawdown relates to a change in water pressure and does not necessarily translate to changes in depth to the watertable. The maximum drawdown over the course of the groundwater model simulation period (from 2013 to 2102) for each 1 km2 grid cell is expected to occur at different times across the area assessed. Close to proposed open-cut and underground mines, confidence in the results of the groundwater model is relatively low because of the very steep hydraulic gradients at the mining interface. As a result, a mine exclusion zone was defined in this assessment. Groundwater drawdown within this 986 km2 zone (the total area of all seven mines) is not used to assess ecological impacts. Mine construction and operational activities within the mine exclusion zone, such as land clearing and surface disturbance, are likely to have greater local impacts to ecosystems than the modelled hydrological changes.Box 4 Calculating groundwater drawdown
Box 5 The zone of potential hydrological change
A zone of potential hydrological change (Figure 1) was defined to rule out areas that are very unlikely to be impacted. It was derived by combining the groundwater zone of potential hydrological change with the surface water zone of potential hydrological change (see Figure 20 and Figure 21 in Lewis et al. (2018)). These zones were defined using hydrological response variables, which are the hydrological characteristics of the system that potentially change due to coal resource development – for example, groundwater drawdown in an aquifer, or the number of zero-flow days per year in a stream.
The groundwater zone is the area with at least a 5% chance of greater than 0.2 m drawdown (Box 4) in the near-surface aquifer layer due to additional coal resource development. This threshold is consistent with the most conservative minimal groundwater impact thresholds in Queensland’s Water Act 2000. Groundwater changes in the near-surface aquifer are important to consider as most groundwater-dependent ecological assets source their water requirements from this watertable.
The surface water zone contains those river reaches where there is at least a 5% chance that a change in any one of eight surface water hydrological response variables exceeds specified thresholds (see Table 9 in Lewis et al. (2018)). These thresholds can generally be described as at least a 5% chance of a 1% (or 3 day) or greater change in a flow volume or event frequency.
Water-dependent ecosystems and ecological assets outside of this zone are very unlikely to experience any hydrological changes due to additional coal resource development (assuming they do not rely on deeper groundwater systems below the near-surface aquifer). Within the zone, potential impacts may need to be considered further. This assessment used regional-scale receptor impact models (Box 9) to translate predicted changes in hydrology within the zone into a distribution of ecological outcomes that may arise from those changes. However, to take account of local conditions, finer-scale assessments may need to be undertaken.
Additional drawdown is the maximum difference in drawdown under the coal resource development pathway and the baseline (Box 1 and Box 4). Because there are no coal resource developments in the baseline for the Galilee subregion, the CRDP includes only the additional coal resource development (ACRD). Results are shown as percent chance of exceeding drawdown thresholds (Box 6). These appear in Lewis et al. (2018) as percentiles. The near-surface aquifer includes the Quaternary alluvium and Cenozoic sediments.
Data: Bioregional Assessment Programme (Dataset 1)
Surface water
The surface water zone of potential hydrological change encompasses many of the streams in the Belyando river basin upstream of Lake Dalrymple (including about 60 km of the Suttor River below its junction with the Belyando). Approximately 3012 km of streams occur in the surface water zone, including most of the Carmichael River, Native Companion Creek and Lagoon Creek - Sandy Creek. Much of the potentially impacted stream network coincides with the two areas of the groundwater zone, apart from an approximately 40 km segment of the Belyando River that separates the two groundwater areas, and parts of Bully Creek and the Belyando/Suttor rivers that flow outwards from the northern groundwater zone. Further information about the surface water zone of potential hydrological change is in Section 3.3.1 of Lewis et al. (2018).
The potential changes to surface water flow regimes due to additional coal resource development over the 90-year modelling period (2013 to 2102) were assessed using three hydrological response variables:
- maximum change in the annual number of zero-flow days (days when streamflow is less than 1 ML/day over the modelled 90-year period for that stream)
- maximum change in annual number of high-flow days (days when streamflow exceeds the 90th percentile of flow from the simulated 90-year period for that stream)
- maximum percentage change in annual flow volume (GL/year) over the simulated 90-year period.
Changes in other surface water hydrological response variables, such as the number and duration of low-flow spells, can be viewed on the BA Explorer at www.bioregionalassessments.gov.au/explorer/GAL/hydrologicalchanges.
In the Burdekin river basin, changes in the surface water flow regime due to modelled additional coal resource development are very unlikely to propagate further downstream than Lake Dalrymple.Key finding 5
Zero-flow days
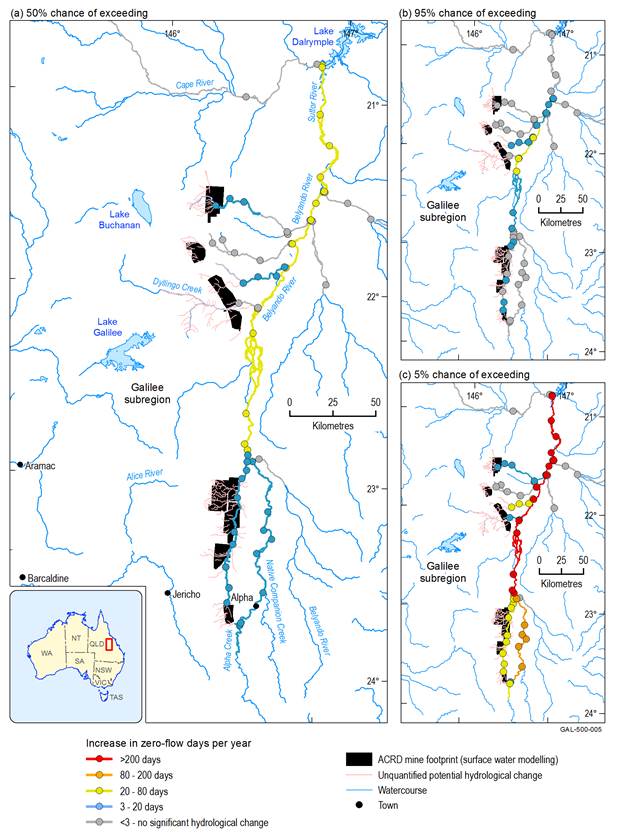
There is a 5% chance that the maximum number of zero-flow days will increase by 200 days per year in the Belyando River downstream of Sandy Creek junction and the Suttor River downstream of its confluence with the Belyando. Such increases are greater than interannual variability and the maximum reduction is most likely to occur in a wet year.Key finding 6
Many reaches of the Belyando and Suttor rivers that have a 5% chance of an additional 200 zero-flow days (Figure 9) do not actually flow for 200 days in most years. This apparent anomalous increase in zero-flow days occurs because, in particularly wet years, modelling indicates that the river can flow for 200 days per year (or more). As bioregional assessments report the maximum change in zero-flow days due to additional coal resource development (over the 90-year period modelled), the reporting is biased towards wet years when these maximum changes can occur.
There is a 50% chance that 1034 km of streams will experience an increase of at least 3 additional zero-flow days per year. A further 1781 km of streams are potentially impacted by increases in zero-flow days, including many streams that will be physically disturbed or diverted as they occur in areas of planned mining operations or mine-site infrastructure. However, these potential impacts could not be quantified for this assessment, as not all stream reaches included in the surface water zone were incorporated in the modelling (Section 3.3.1.2 in Lewis et al. (2018)).
Where changes have been quantified, 1108 km of streams are very likely to experience an increase of at least 3 additional zero-flow days per year in the year of maximum change (Figure 9). This includes parts of the Belyando River downstream of where it meets with Sandy Creek to Lake Dalrymple (Burdekin Falls Dam), and the Carmichael River, as well as the east-flowing North and Bully creeks that drain the northern part of the zone of potential hydrological change. It is very unlikely that more than 591 km of streams will experience increases of more than 200 zero-flow days per year. There are no streams where it is very likely that there will be increases of more than 200 zero-flow days per year (Figure 9).
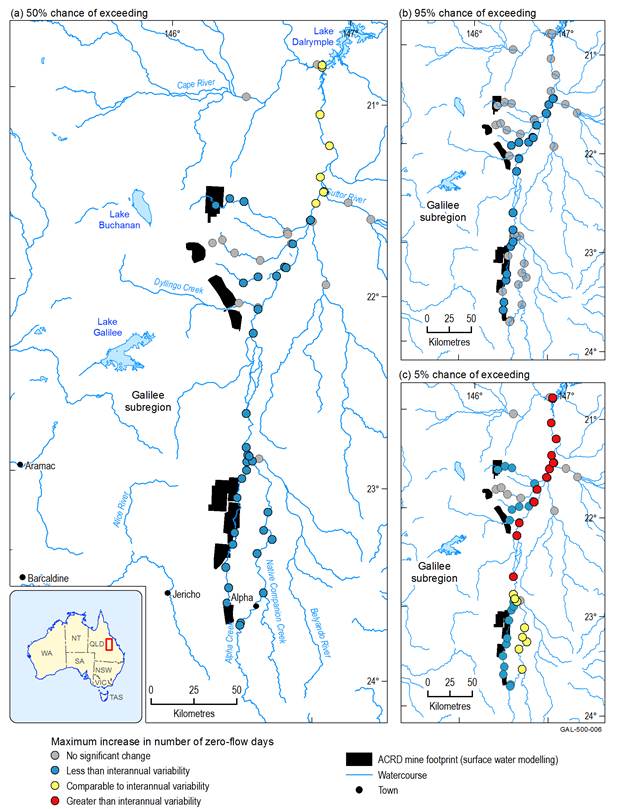
There is a 50% chance that modelled changes are comparable to interannual variability in the northernmost stretches of the Belyando and Suttor rivers upstream of Lake Dalrymple, particularly for the modelled nodes downstream of the Belyando River junction with the Suttor River. Results also indicate a 5% chance that central and northern stretches of the Belyando River within the zone may experience increases in zero-flow days above interannual variability (Figure 10).
Changes in zero-flow days that are greater than interannual variability indicate that the ecological components of these riverine ecosystems may be less able to adapt to changes in hydrology due to additional coal resource development. However, in some circumstances, even changes that are comparable to or less than interannual variability may still be ecologically important, especially if they occur over a prolonged period.
The coal resource development pathway (CRDP) includes baseline and additional coal resource developments (ACRD). Because there are no coal resource developments in the baseline for the Galilee subregion, the CRDP includes only the ACRD. The difference in zero-flow days between the CRDP and baseline is due to ACRD. Results are shown as percent chance of exceeding given values of change (Box 6). These appear in Lewis et al. (2018) as percentiles.
Data: Bioregional Assessment Programme (Dataset 1, Dataset 12)
The coal resource development pathway (CRDP) includes baseline and additional coal resource developments (ACRD). The difference in zero-flow days between the CRDP and baseline is due to ACRD. Because there are no coal resource developments in the baseline for the Galilee subregion, the CRDP includes only the ACRD. Results are shown as percent chance of exceeding given values of change (Box 6). These appear in Lewis et al. (2018) as percentiles.
Data: Bioregional Assessment Programme (Dataset 1, Dataset 12)
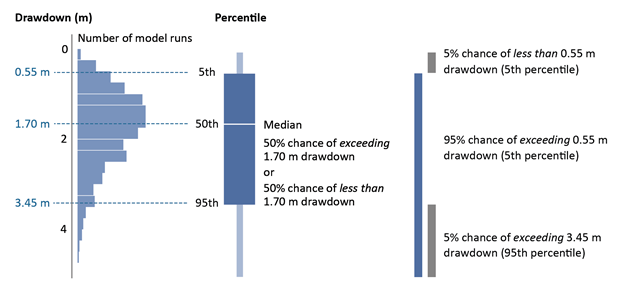
The chart on the left shows the distribution of results for drawdown in one assessment unit, obtained from an ensemble of thousands of model runs that use many sets of parameters. These generic results are for illustrative purposes only.
The models used in the assessment produced a large number of predictions of groundwater drawdown and streamflow characteristics rather than a single number. This results in a range or distribution of predictions, which are typically reported as probabilities – the percent chance of something occurring (Figure 11). This approach allows an assessment of the likelihood of exceeding a given magnitude of change, and underpins the assessment of risk. Hydrological models require information about physical properties, such as the thickness of geological layers and how porous aquifers are. As it is unknown how these properties vary at every point (both at surface and at depth) in the assessment extent, the hydrological models were run thousands of times using different sets of values drawn from credible ranges of those physical properties. Optimisation of model runs enabled the reproduction of historical observations, such as groundwater level and changes in water movement and volume. A narrow range of predictions indicates more agreement between the model runs, which enables decision makers to anticipate potential impacts more precisely. A wider range indicates less agreement between the model runs and hence more uncertainty in the outcome. The distributions created from these model runs are expressed as probabilities that hydrological response variables (such as drawdown) exceed relevant thresholds, as there is no single ‘best’ estimate of change. In this assessment, the estimates of drawdown or streamflow change are shown as a 95%, 50% or 5% chance of exceeding thresholds. Throughout this synthesis, the term ‘very likely’ is used to describe where there is a greater than 95% chance that the model results exceed thresholds, and ‘very unlikely’ is used where there is a less than 5% chance. While models are based on the best available information, if the range of parameters used is not realistic, or if the modelled system does not reflect reality sufficiently, these modelled probabilities might vary from the actual changes that occur in reality. These regional-level models provide a range of evidence to help rule out potential cumulative impacts due to additional coal resource development in the future. Figure 12 Key areas for reporting probabilistic results The assessment extent was divided into smaller square assessment units and the probability distribution (Figure 11) was calculated for each. In this synthesis, results are reported with respect to the following key areas (Figure 12):Box 6 Understanding probabilities
High-flow days
The maximum changes in high flows and annual flows due to modelled additional coal resource development are smaller than interannual variability, particularly in the Belyando and Suttor rivers, but there is a 5% chance that they are comparable to the interannual variability along Sandy and North creeks, and parts of Bully Creek.Key finding 7
The impact due to modelled additional coal resource development on high-flow days is not as great as it is on zero-flow days. For example, there is a 50% chance that 313 km of modelled streams will have at least a 3-day reduction in high-flow days per year (Table 15 in Lewis et al. (2018)). Reductions in high-flow days of at least 3 days per year are very likely along Lagoon Creek and Sandy Creek, where it runs adjacent to the China First, Alpha and Kevin’s Corner proposed coal mines in the south, and in the north along North Creek (Figure 31 and Table 15 in Lewis et al. (2018)).
Modelling predicted that it is very unlikely that more than 200 km of streams will experience reductions in high-flow days in excess of 50 days per year (Figure 31 and Table 15 in Lewis et al. (2018)), and these are mainly confined to stretches of Sandy Creek in the southern zone, and North Creek in the northern zone. There is a 5% chance that the upper reaches of Bully Creek (which intersect the proposed Hyde Park Coal Mine) may experience reductions of between 20 and 50 high-flow days per year (Figure 31 and Table 15 in Lewis et al. (2018)).
The northern reaches of the Belyando and Suttor rivers above Lake Dalrymple experience a 5% chance of the most substantial increases in zero-flow days of anywhere in the modelled stream network; however, they have relatively minor impacts on high-flow days. This indicates that although large changes in the low-flow regime may accumulate and affect downstream areas, changes in high flow are less likely to accumulate from multiple developments and propagate downstream.
At most modelled locations, the maximum change is relatively small compared to interannual variability (Figure 33 in Lewis et al. (2018)), although there is a 5% chance that some modelled locations may experience changes comparable to interannual variability (Figure 33 in Lewis et al. (2018)).
Annual flow
There is a 50% chance that 833 km of modelled streams are subject to at least a 1% reduction in mean annual flow volume. A further 1442 km of streams are potentially impacted by changes in annual flow, but these could not be quantified for this assessment (see Section 3.3.1.2 in Lewis et al. (2018)).
About 6 km of the modelled streams are very likely to experience greater than 20% reduction in annual flow volume, just downstream of the proposed South Galilee Coal Mine on Tallarenha Creek. Similarly, 269 km of the modelled streams are expected to have greater than 5% reduction in annual flow. The streams that are predicted to have the greatest reductions in annual flow are:
- Tallarenha Creek - Sandy Creek, where the stream starts at South Galilee and flows northwards adjacent to the three neighbouring mines in the southern cluster at China First, Alpha and Kevin’s Corner
- North Creek, which flows in an easterly direction from the area of the proposed Carmichael and China Stone mines towards the Belyando River
- some segments of Bully Creek just downstream of the Hyde Park Coal Project.
There is a 5% chance that the maximum change in annual flow due to modelled additional coal resource development will be comparable to annual flow variability under the baseline for parts of Sandy Creek, North Creek and Bully Creek (Figure 36 in Lewis et al. (2018)). Reductions in annual flow at all other modelled locations are less than interannual variability.
Water quality
Water quality was not modelled as part of this assessment. However, the implications for water quality in the Galilee subregion are briefly considered in Section 3.3.4 of the impact and risk analysis (Lewis et al., 2018) in light of the modelled hydrological changes due to additional coal resource development.
The groundwater modelling results presented in Peeters et al. (2018) indicated that drawdown due to additional coal resource development will be confined primarily to the upper Permian coal measures, and to a lesser extent the Clematis Group aquifer, and in areas where alluvium and Cenozoic sediments overlie the deeper Galilee Basin aquifers. These conditions largely occur around the central-eastern margin of the Galilee Basin in the vicinity of the proposed coal mines modelled in this assessment. Hence, any groundwater quality changes are unlikely to occur outside of areas where these aquifers may experience drawdown.
The likelihood of off-site water quality impacts to broader surface water systems is reduced through the capture of surface water on mine sites, which is then utilised for various on-site processes. However, as of July 2017, conditions for off-site discharge of any excess water are yet to be finalised for the additional coal resource developments. Discharge requirements will form part of mine approval conditions.
Explore the hydrological changes in more detail at www.bioregionalassessments.gov.au/explorer/GAL/hydrologicalchanges Surface water numerical modelling, product 2.6.1 (Karim et al., 2018a) Groundwater numerical modelling, product 2.6.2 (Peeters et al., 2018) Impact and risk analysis, product 3-4 (Lewis et al., 2018) Groundwater modelling, submethodology M07 (Crosbie et al., 2016) Impacts and risks, submethodology M10 (Henderson et al., 2018) Impact and risk analysis database (Dataset 1)FIND MORE INFORMATION
Product Finalisation date
- Executive summary
- Explore this assessment
- About the subregion
- How could coal resource development result in hydrological changes?
- What are the potential hydrological changes?
- What are the potential impacts of additional coal resource development on ecosystems?
- What are the potential impacts of additional coal resource development on water-dependent assets?
- How to use this assessment
- Building on this assessment
- References and further reading
- Datasets
- Contributors to the Technical Programme
- Acknowledgements
- Citation

