1.3.1.4.1 Assessment principles
Once assets were compiled into the asset database and checked for inclusion in the Cooper PAE, they were assessed for water dependence. Although most nominated assets are, by definition of their database sources, ‘water dependent’ (e.g. groundwater bores, rivers, lakes and wetlands), there are a number of types of assets that are less clearly ‘water dependent’ (e.g. a national park with a varied landscape, the habitat of a non-aquatic species and historical places). Because of the diversity of asset types, the spectrum of degree to which assets might be water dependent, and the need for all assessment decisions to be transparent and recorded, a highly structured, formal approach was developed for assessment of water dependency.
Six principles formed the foundation of the approach to assessment of water dependence of assets in the Cooper PAE:
- Efficiency. The methods were suitable for effective application to large numbers of assets.
- Transparency. All decisions in assessments were tracked, including their rationales, any data sources and dates of assessments.
- Rigour. Decision making was based on sound ecological, economic and sociocultural principles and clear logic, and able to withstand close peer and expert scrutiny.
- Multiple lines of evidence. Wherever possible, assessment decisions were based on as many sources of information about water dependence as possible. Three broad groups of evidence were used: (i) asset naming conventions, (ii) documents describing asset management and (iii) GIS and remote sensing databases containing layers that directly or indirectly quantify surface water and groundwater availability.
- Precaution. Where part of an asset is water dependent, the entire asset was assessed as water dependent. Where there is inconclusive evidence, assessment decisions consistently erred on the side of assuming potential water dependence (i.e. if one data source indicates water dependence, then the overall decision across the multiple lines of evidence is water dependence). On this basis, the maximum number of assets was retained within the database for subsequent analysis of potential development impacts.
- Separate tracking of assessment for dependence on groundwater and surface water. Later stages of the BA impact analysis are likely to demonstrate separate causal pathways for potential impact of coal resource development via surface water and groundwater systems. If that proves to be the case, then potential for impact on an asset via the surface water or groundwater pathway will only be true if the asset depends on the corresponding above or below-ground water resource (Figure 4).
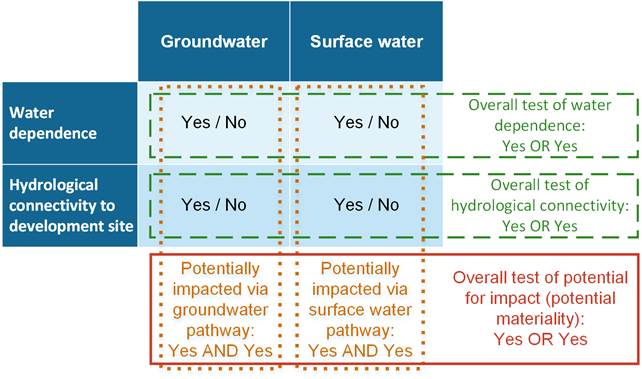
Figure 4 Logic for separate assessment and tracking of dependence on groundwater and surface water
This product focuses exclusively on assessment of water dependence i.e. the upper part of this logic. Future bioregional assessments for the Cooper subregion will assess hydrological connectivity and response, and thus the potential for impact on assets.
1.3.1.4.2 Assessment criteria using asset naming conventions
For some asset sources, the only direct information available for assessing water dependence of each asset is its name. The Australian Hydrological Geospatial Fabric (AHGF), Great Artesian Basin Groundwater Recharge Beds database and National Groundwater Information System (NGIS) are databases in which little asset data other than name and geographic coordinates are available. The Queensland and SA groundwater licensing from the water management system databases are also restricted in terms of information other than asset name and type.
Two simple naming criteria were used to assess water dependence for assets of these types:
- if asset name includes ‘spring’, ‘soakage’, ‘bore’ or ‘groundwater’, then the asset is groundwater dependent
- if asset name includes ‘river’, ‘stream’, ‘floodplain’, ‘waterhole’, ‘billabong’, ‘lake’, ‘wetland’, ‘marsh’ or ‘surface water’, then the asset is surface water dependent.
Although initially developed for specific, information-poor data sources, these rules were subsequently applied to all assets in the asset list, regardless of data source.
1.3.1.4.3 Assessment criteria using documents describing asset management
Most assets sourced from CAPAD, DIWA, and the EPBC Act list of threatened ecological communities are subject to legislatively required management plans that include some degree of ecosystem description. For these assets, management plans and/or asset descriptions were obtained from federal and state agencies. The management plans and their constituent ecosystem descriptions were then subjected to text analysis, using the following simple criteria to assess water dependence:
- if ecosystem description includes ‘spring’, then asset is groundwater dependent
- if ecosystem description includes any ecosystem type, community type, habitat type or dominant species and has been identified in any published literature as accessing groundwater (e.g. river red gum, coolibah (Eucalyptus coolabah), fish species), then asset is groundwater dependent
- if ecosystem description includes ‘riverine vegetation’, ‘floodplain’, ‘waterhole’, ‘billabong’, ‘lake’, ‘wetland’ or ‘marsh’, then asset is surface water dependent
- if ecosystem description includes any ecosystem type, community type, habitat type or dominant species known to access surface water (e.g. river red gum, coolibah, lignum, most waterbird species, fish), then asset is surface water dependent.
According to these criteria, examination of documents about one asset may yield determination for both groundwater dependence and surface water dependence in one ecosystem type or in different ecosystem types in different parts of the asset.
The water dependency of threatened species’ habitats, including threatened species listed under the EPBC Act and under Queensland’s Nature Conservation Act 1992 (Nature Conservation Act), was assessed by a review of the habitat requirements for each species. It is important to emphasise that BAs consider the potential impact to the habitat of species, not to the population of the species per se. In most cases, profiles from the Species Profile and Threats Database (SPRAT) (Department of the Environment, 2015b; Bioregional Assessment Programme, Dataset 24) and the Queensland Government’s WetlandInfo website (DEHP, 2015) were examined.
Any information suggesting that water dependence was ‘certain’, ‘likely’ or ‘possible’ was interpreted as ‘water dependent’ for the purposes of the asset register.
1.3.1.4.4 Assessment criteria using geographical information system and remote sensing databases
Criteria based upon asset naming and upon available, published asset descriptions and management plans proved to be inadequate for satisfactory assessment of water dependence in a large proportion of assets. Other sources of information were sought to expand the range of data available for assessment of asset water dependence.
Six mapped GIS and remote sensing data layers were identified as providing additional information relevant to assessing dependence on surface water or groundwater. GIS analyses were used to spatially intersect each asset with each of the five data layers. If any part of an asset was found to overlap with any one of these layers, then that observation was used as evidence for water dependence, according to the precautionary principle previously described in Section 1.3.1.4.1 .
The six data layers were:
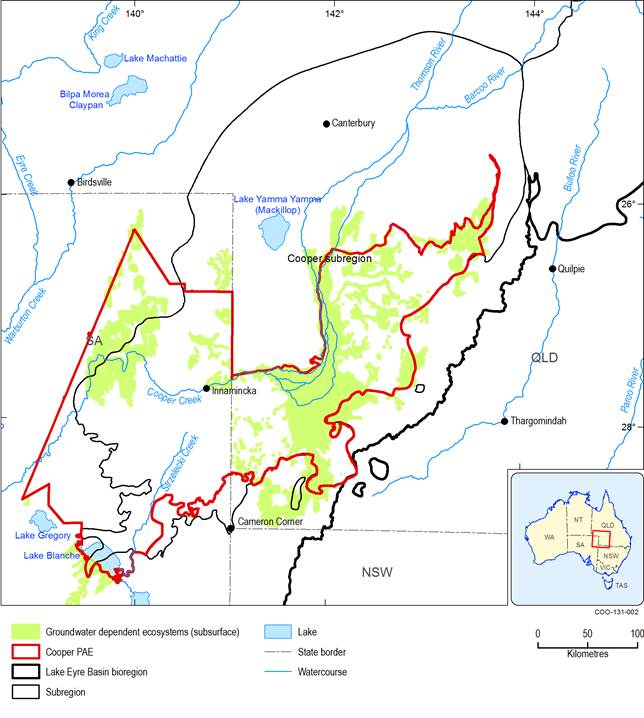
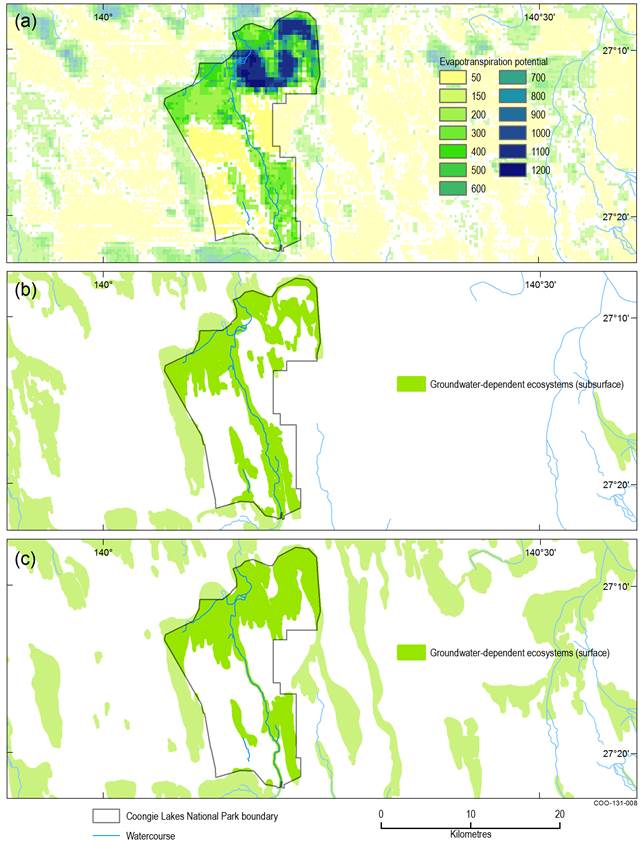
- GDEs reliant on subsurface presence of groundwater, derived from the National atlas of groundwater dependent ecosystems ; Bureau of Meteorology, 2012). Subsurface presence of groundwater is defined as groundwater that contributes to the soil water and near-surface aquifers accessible to plant roots without generating a flow of water at the soil surface. Only those GDEs derived from previous field work or possessing a high or moderate potential for groundwater dependency were used in the intersection. Positive intersection of an asset with this layer indicates potential dependency on groundwater. A map of this data layer across the Cooper PAE is shown in Figure 5 .
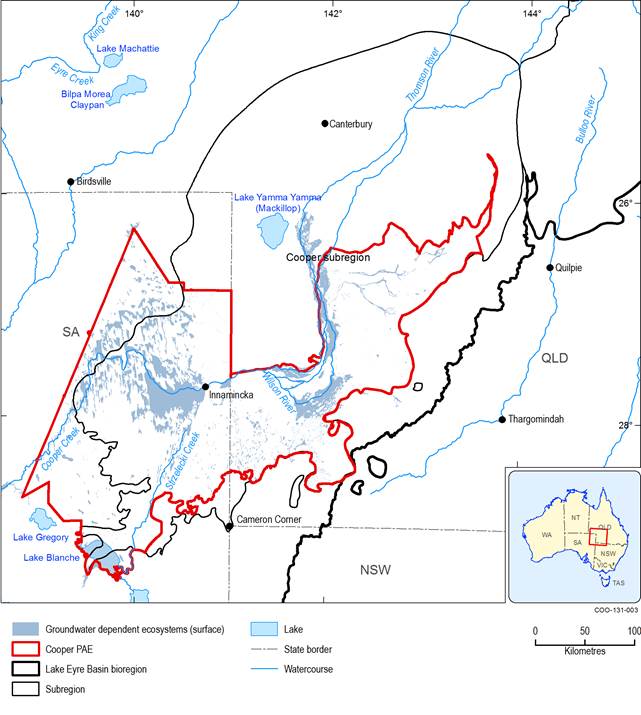
- GDEs reliant on surface expression of groundwater, derived from the GDE Atlas (Bureau of Meteorology, 2012). Surface expression of groundwater is defined as groundwater that flows at the soil surface in the form of a spring or seep, including those springs that lie under surface water bodies such as streams, waterholes, lakes or swamps, for which the primary source of water may be from surface flows. Only those GDEs derived from previous field work or possessing a high or moderate potential for groundwater dependency were used in the intersection. Positive intersection of an asset with this layer indicates potential dependency on groundwater and/or surface water. A map of this data layer across the Cooper PAE is shown in Figure 6 .
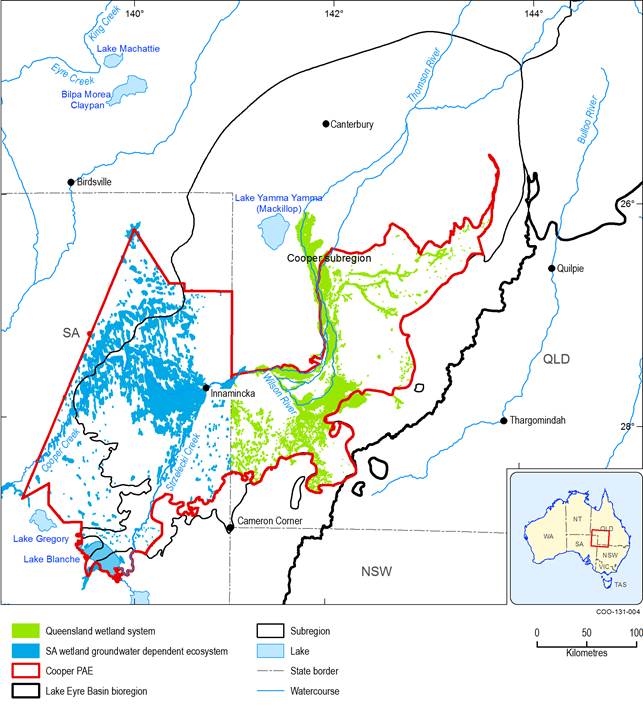
- A combined multi-state map of wetlands defined according to the Queensland Wetland Data Streams and SA Wetlands Groundwater Dependent Ecosystem Classification. Positive intersection of an asset with this layer indicates potential dependency on subsurface or surface expression of groundwater. A map of this data layer for the Cooper PAE is shown in Figure 7.
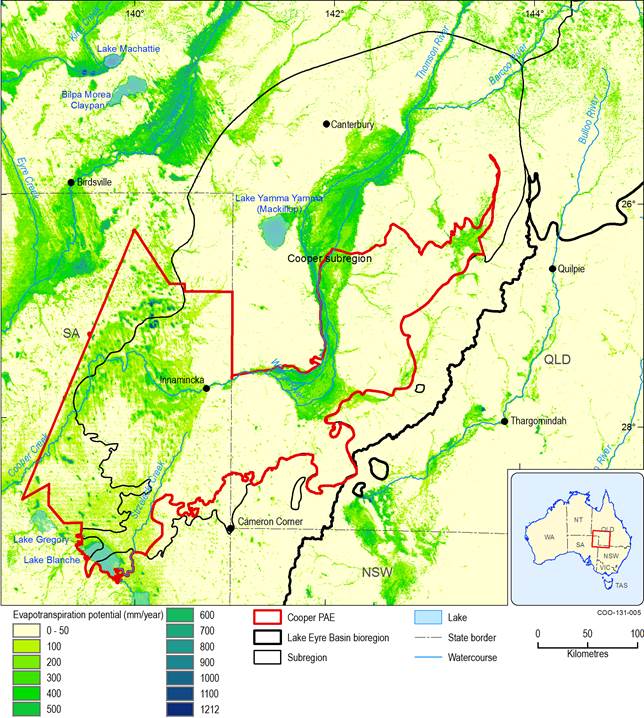
- Mean annual evapotranspiration in excess of incident rainfall across the Cooper PAE (Reside et al., 2013). This layer is calculated as the difference between actual evapotranspiration assessed through remote sensing techniques during 1992 to 2011 and a predicted model of evapotranspiration if water were sourced only from incident rainfall. A positive difference means that long-term observation of the amount of water released into the atmosphere by plant evapotranspiration exceeds the inputs of water from rainfall, and the vegetation is accessing additional water from groundwater pools or contributions to soil water. These contributions to soil water result from surface water flowing from elsewhere in the catchment; however, the data were not able to be interpreted to indicate whether the additional water is from a groundwater pool or surface water flow. Thus, intersection of an asset with high excess evapotranspiration values (>100 mm per year) in this layer indicates potential dependency on groundwater and/or surface water. A map of this data layer across the Cooper PAE is shown in Figure 8 .
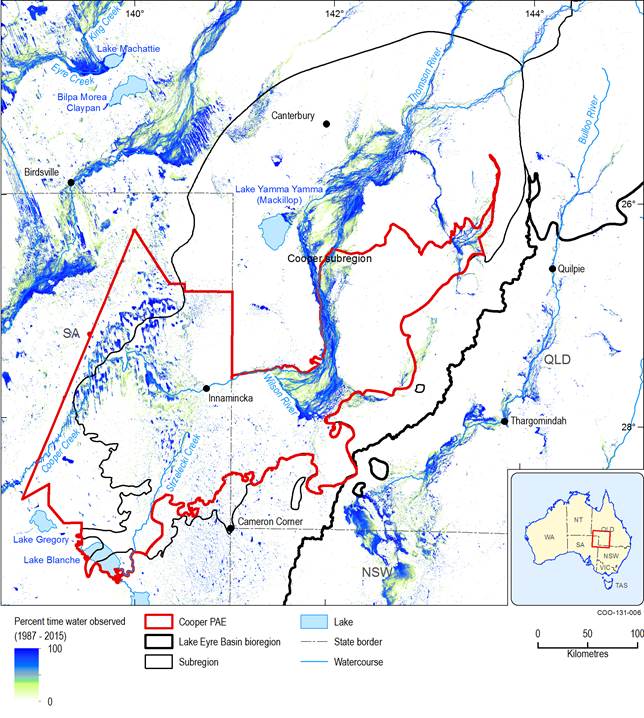
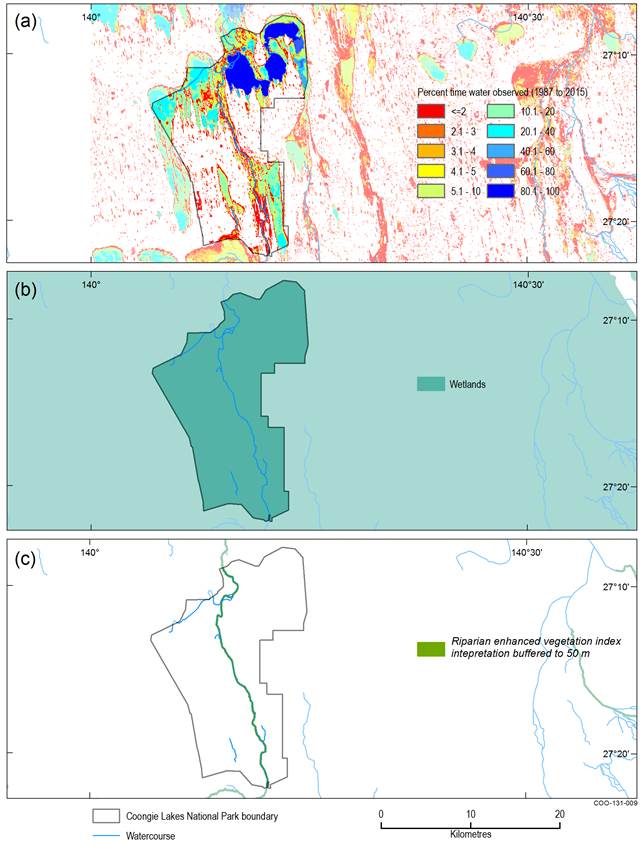
- Percentage duration of flood inundation during 1987 to 2015, from the Water Observations from Space database (Bioregional Assessment Programme, Dataset 25). Positive intersection of an asset with higher percentage inundation classes in this layer indicates potential dependency on surface water. A map of this data layer across the Cooper PAE is shown in Figure 9 .
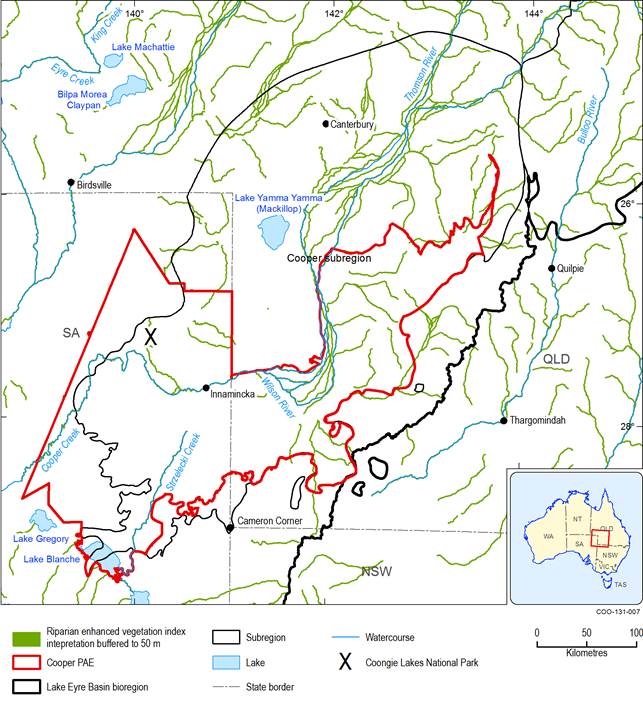
- The distribution of riparian vegetation potentially intersecting groundwater (Geoscience Australia, Dataset 26). This layer summarises the results of an analysis of remote sensing data to measure evapotranspiration rates towards the end of a prolonged period of below average rainfall. Positive intersection of an asset with this layer indicates potential dependency on groundwater. A map of this data layer across the Cooper PAE is shown in Figure 10 .
Application of this approach is demonstrated for a single asset in the Cooper PAE, Coongie Lakes National Park (Figure 11 and Figure 12). Coongie Lakes National Park sits to the north of Cooper Creek, west of the border between Queensland and SA (see Figure 10). All six GIS and remote sensing layers provide clear evidence for dependence on groundwater and/or surface water in and around the lakes in the northern portion of the park, the creeklines through the central portion of the park, and the claypans and swales that lie between the sand dunes in the rest of the park. Therefore, this asset was assessed to be water dependent and is included in the water-dependent asset register. However, it is important to note that in the eastern and south-west portions of the park, each of the six layers provides evidence for different patterns of potential water dependence. Thus the six layers provide independent and complementary lines of evidence for the assessment of asset dependence on water.
Data: Bureau of Meteorology (Dataset 8)
Data: Bureau of Meteorology (Dataset 8)
Data: Queensland Department of Science, Information Technology, Innovation and the Arts (Dataset 15), South Australian Department of Environment, Water and Natural Resources (Dataset 18)
Data: Bioregional Assessment Programme (Dataset 27)
Data: Bioregional Assessment Programme (Dataset 25)
Data: Bioregional Assessment Programme (Dataset 29)
Data: Bioregional Assessment Programme (Dataset 27), Bureau of Meteorology (Dataset 8)
Data: Bioregional Assessment Programme (Dataset 25, Dataset 29); South Australian Department of Environment, Water and Natural Resources (Dataset 18)
