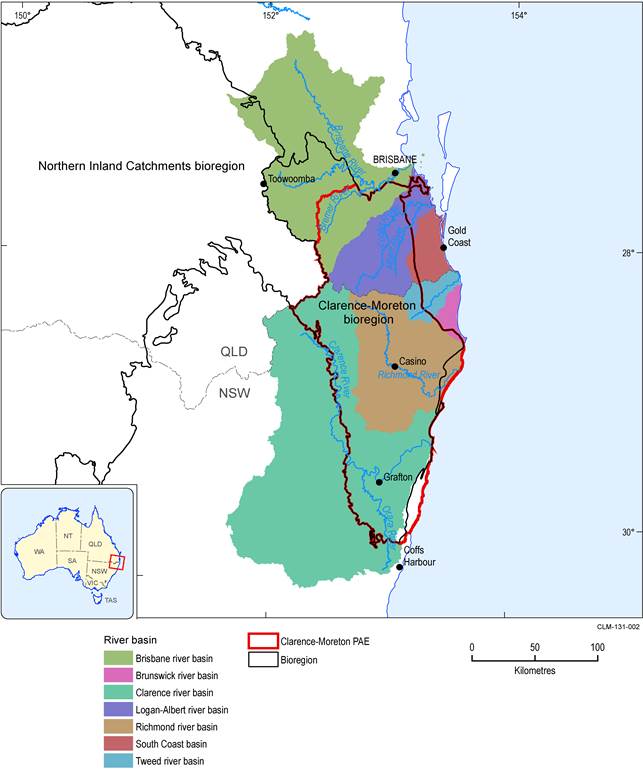
The PAE is the geographic area associated with a bioregion or subregion in which the potential water-related impact of coal resource development on assets is assessed. Determining the PAE is the first step to identifying the potentially impacted assets. In the case of the Clarence-Moreton bioregion, the PAE was defined by the extent of the geological basin and the extent of the Walloon Coal Measures, the primary stratigraphic target for coal mining and CSG exploration in the Clarence-Moreton Basin. As described by Rassam et al. (2014), the Clarence-Moreton bioregion only includes the eastwards draining part of the Clarence-Moreton Basin. A detailed overview on the characteristics of the stratigraphic units and the geological framework of the Clarence-Moreton bioregion is given in products 1.1 and 1.2 of the Clarence-Moreton BA (Rassam et al., 2014; Raiber et al., 2014). The PAE boundary is conservative; it includes older sedimentary bedrock units of the Clarence-Moreton Basin (stratigraphically below the Walloon Coal Measures) up-gradient and typically more than 20 km away from any areas of coal seam gas exploration activities (Figure 3).
The PAE almost comprises the entire Clarence-Moreton bioregion (Figure 3 and Figure 5), with the exception being parts of the Brisbane river basin (Lockyer Valley) (Figure 3). Here, the Walloon Coal Measures are either absent or very thin (<50 to 100 m) and covered by more than 100 m of basalts, and this area is therefore not a coal seam gas exploration target. The older sedimentary bedrock units of the Clarence-Moreton Basin which are present in the Lockyer Valley are up-gradient from areas where coal seam gas exploration has occurred (Figure 3) and are therefore unlikely to be impacted by any CSG activities.

Data: Bioregional Assessment Programme (Dataset 21, Dataset 22)
There is only a very limited understanding of the hydraulic connectivity between the basal Clarence-Moreton Basin aquifers and the basement aquifers, which underlie the Clarence-Moreton Basin (Figure 4). However, the rocks that form the hydraulic basement to the Clarence-Moreton Basin sedimentary sequences are part of the New England Orogen (e.g. Texas Block, Coffs Harbour Block and Beenleigh Block), which is dominated by granitic plutons, igneous complexes or metasedimentary rocks (Rassam et al., 2014). These rock types are commonly considered to have characteristics of low-permeability and low-yielding aquifers or aquitards. In addition, these areas are up-gradient from the proposed areas of CSG development. Hence, there is unlikely to be any significant connectivity between rock sequences of the Clarence-Moreton Basin and the underlying basement rocks, and it is very unlikely that drawdown resulting from the depressurisation of the coal seams will have any influence on basement units outside the area of the Clarence-Moreton bioregion. Consequently, the basement rocks of the New England Orogen outside the Clarence-Moreton bioregion were not incorporated into the PAE.
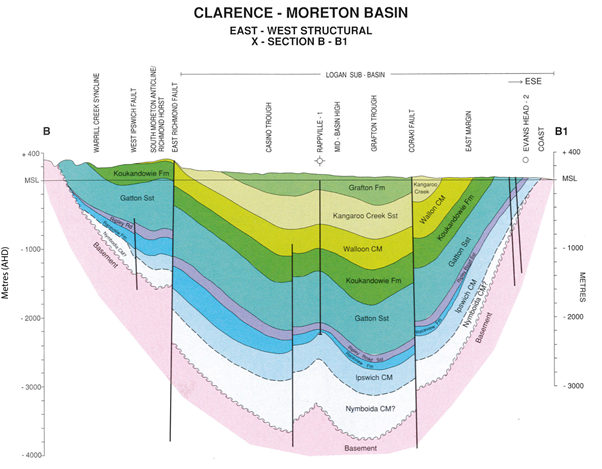
Source: Ingram and Robinson (1996). This figure is not covered by a Creative Commons Attribution licence. It has been reproduced with permission from NSW Trade and Investment.
Currently, the understanding on groundwater flow and surface water – groundwater interaction, especially in the NSW part of the Clarence-Moreton bioregion, is limited due to the lack of data for deeper formations and the complexity of the geology and hydrology.
The coastal areas at the eastern part of the Richmond and Clarence river basins outside the Clarence-Moreton bioregion boundary (Figure 3 and Figure 5) are included in the PAE, as any changes of surface water quality or quantity may have impact on the water-dependent assets in these areas.
Data: Geoscience Australia (Dataset 23)
